ES Daily Plan | November 10, 2023
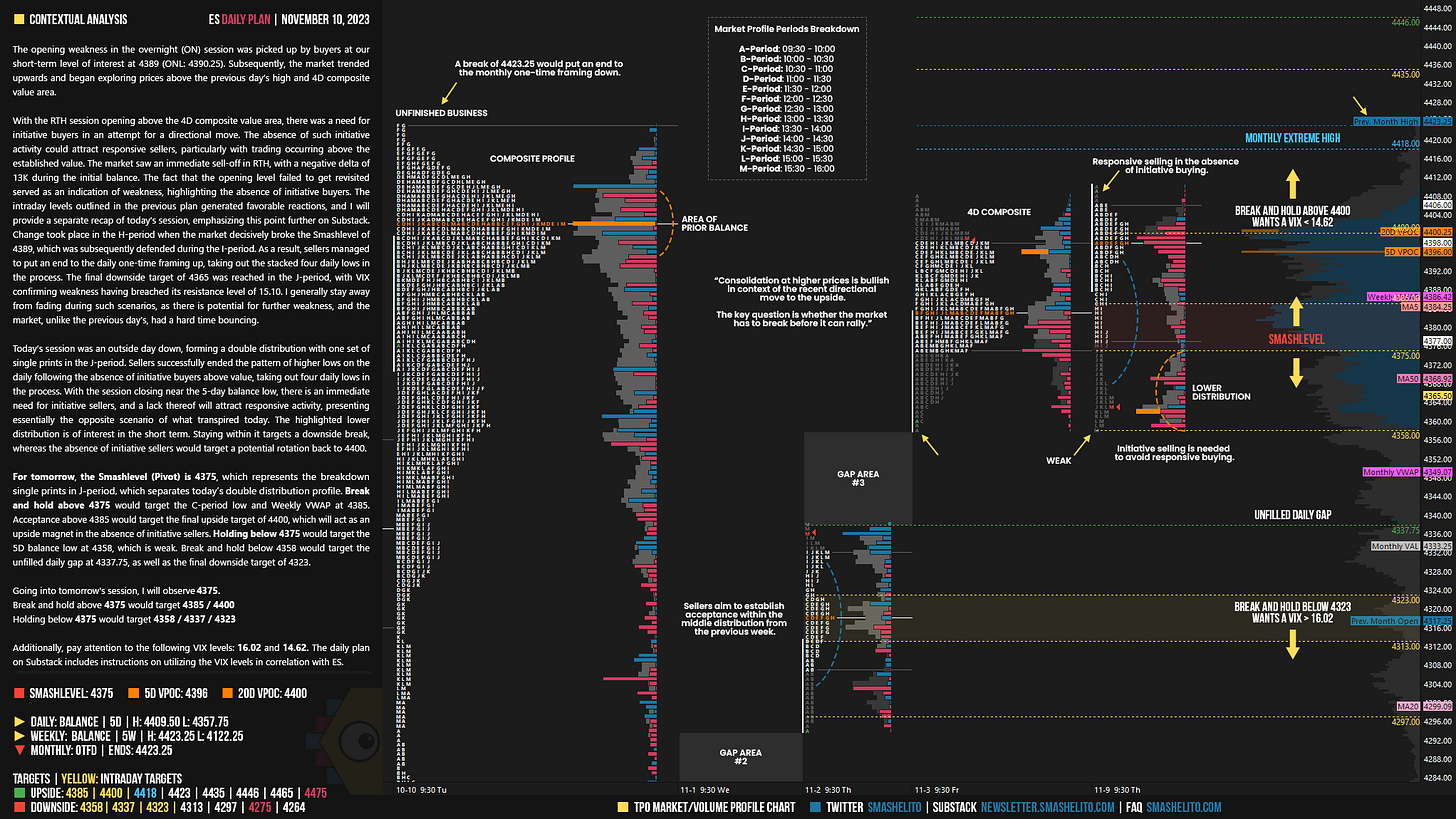
Today’s session was an outside day down, forming a double distribution with one set of single prints in the J-period.
Visual Representation
For new followers, the yellow levels highlighted at the bottom are the primary levels that I focus on intraday. My strategy for preventing impulsive decisions at unfavorable locations involves following a simple yet effective rule of exercising caution when initiating trades outside of the yellow levels. This implies that I am cautious chasing longs above the final yellow upside target and shorts below the final yellow downside target. It is crucial to understand that refraining from chasing a trade is not an automatic invitation to initiate a trade in the opposite direction.
Contextual Analysis
The opening weakness in the overnight (ON) session was picked up by buyers at our short-term level of interest at 4389 (ONL: 4390.25). Subsequently, the market trended upwards and began exploring prices above the previous day’s high and 4D composite value area.
With the RTH session opening above the 4D composite value area, there was a need for initiative buyers in an attempt for a directional move. The absence of such initiative activity could attract responsive sellers, particularly with trading occurring above the established value. The market saw an immediate sell-off in RTH, with a negative delta of 13K during the initial balance. The fact that the opening level failed to get revisited served as an indication of weakness, highlighting the absence of initiative buyers. The intraday levels outlined in the previous plan generated favorable reactions, and I will provide a separate recap of today’s session, emphasizing this point further on Substack.
Change took place in the H-period when the market decisively broke the Smashlevel of 4389, which was subsequently defended during the I-period. As a result, sellers managed to put an end to the daily one-time framing up, taking out the stacked four daily lows in the process. The final downside target of 4365 was reached in the J-period, with VIX confirming weakness having breached its resistance level of 15.10. I generally stay away from fading during such scenarios, as there is potential for further weakness, and the market, unlike the previous day’s, had a hard time bouncing.
Today’s session was an outside day down, forming a double distribution with one set of single prints in the J-period. Sellers successfully ended the pattern of higher lows on the daily following the absence of initiative buyers above value, taking out four daily lows in the process. With the session closing near the 5-day balance low, there is an immediate need for initiative sellers, and a lack thereof will attract responsive activity, presenting essentially the opposite scenario of what transpired today. The highlighted lower distribution is of interest in the short term. Staying within it targets a downside break, whereas the absence of initiative sellers would target a potential rotation back to 4400.
Balance Rules: The general guideline suggests going with the break of the highlighted balance area and monitoring for continuation (Acceptance) or lack thereof (Rejection). If there's a lack of continuation following a breakout attempt, it can trigger moves in the opposite direction.
For tomorrow, the Smashlevel (Pivot) is 4375, which represents the breakdown single prints in J-period, which separates today’s double distribution profile. Break and hold above 4375 would target the C-period low and Weekly VWAP at 4385. Acceptance above 4385 would target the final upside target of 4400, which will act as an upside magnet in the absence of initiative sellers. Holding below 4375 would target the 5D balance low at 4358, which is weak. Break and hold below 4358 would target the unfilled daily gap at 4337.75, as well as the final downside target of 4323.
Levels of Interest
Going into tomorrow's session, I will observe 4375.
Break and hold above 4375 would target 4385 / 4400
Holding below 4375 would target 4358 / 4337 / 4323
Additionally, pay attention to the following VIX levels: 16.02 and 14.62. These levels can provide confirmation of strength or weakness.
Break and hold above 4400 with VIX below 14.62 would confirm strength.
Break and hold below 4323 with VIX above 16.02 would confirm weakness.
Overall, it's important to exercise caution when trading outside of the highlighted yellow levels. A non-cooperative VIX may suggest possible reversals i.e trade setups.
Weekly Plan
Be sure to check out the Weekly Plan, which provides a broader perspective and highlights significant levels of interest to watch in the coming week.
Disclaimer: Futures and options trading involves a high level of risk, with the potential for substantial losses. The information provided in this newsletter is for informational purposes only and is not intended to be a trade recommendation. It is the responsibility of the reader to make their own investment decisions and they should seek the advice of a qualified securities professional before making any investments. The owners/authors of this newsletter are not certified as registered financial professionals or investment advisers.


Levels were surgical as always! Thank you!
Damn, thank you! trying to understand market profiling and this is helping guide. not a lot of initiative selling suggested that Nov 10th day could reclaim the low of Nov 9th and cause responsive buying.
Btw is this book map the 2nd picture?