ES Daily Plan | May 15, 2023
The market remains in a state of consolidation, awaiting further market-generated information.
Both the upside gap of 4182.25 and the downside gap of 4098.25 have yet to be filled. Responsive trading remains.
Contextual Analysis
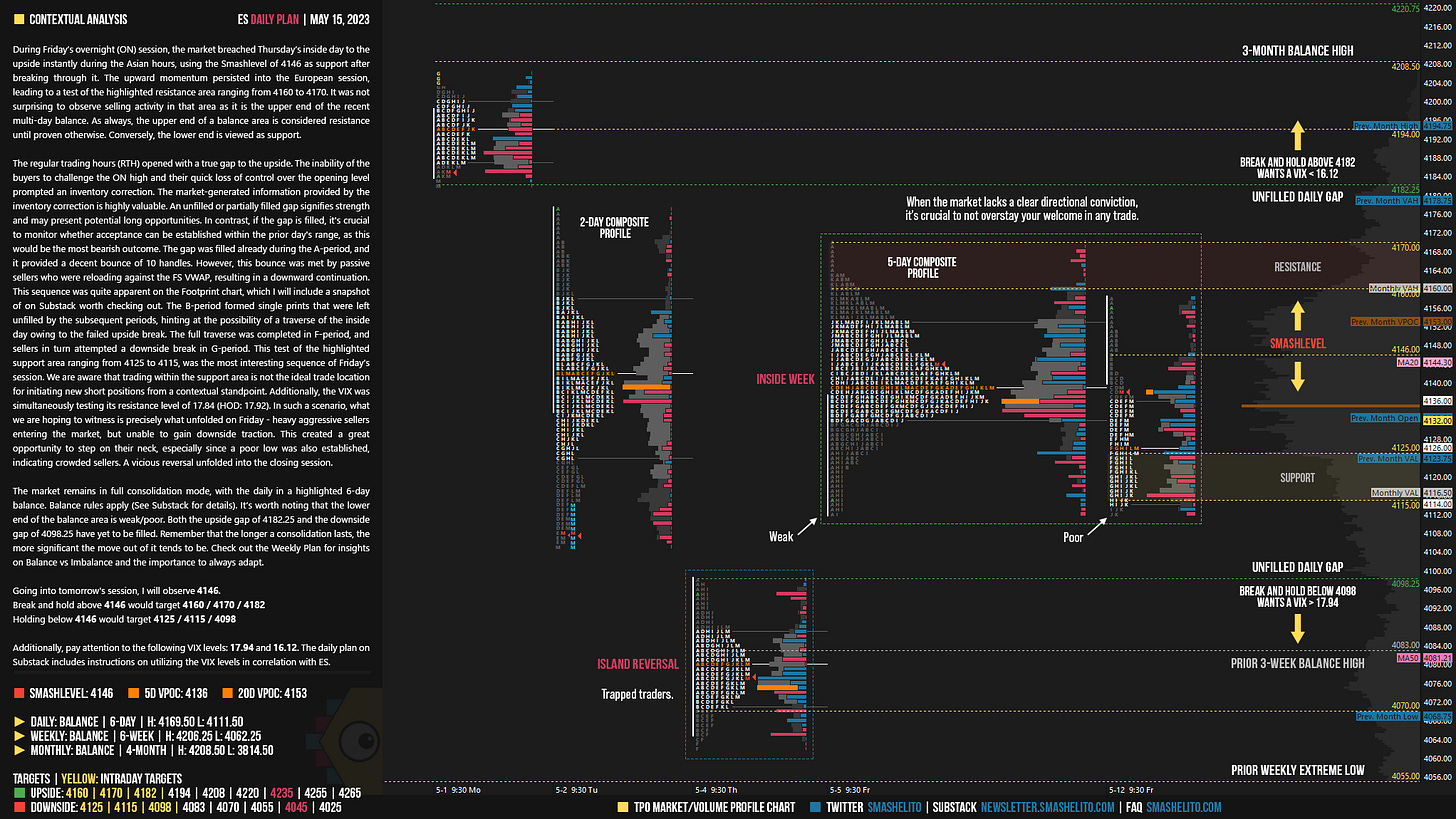
During Friday’s overnight (ON) session, the market breached Thursday’s inside day to the upside instantly during the Asian hours, using the Smashlevel of 4146 as support after breaking through it. The upward momentum persisted into the European session, leading to a test of the highlighted resistance area ranging from 4160 to 4170. It was not surprising to observe selling activity in that area as it is the upper end of the recent multi-day balance. As always, the upper end of a balance area is considered resistance until proven otherwise. Conversely, the lower end is viewed as support.
The regular trading hours (RTH) opened with a true gap to the upside. The inability of the buyers to challenge the ON high and their quick loss of control over the opening level prompted an inventory correction. The market-generated information provided by the inventory correction is highly valuable. An unfilled or partially filled gap signifies strength and may present potential long opportunities. In contrast, if the gap is filled, it's crucial to monitor whether acceptance can be established within the prior day's range, as this would be the most bearish outcome. The gap was filled already during the A-period, and it provided a decent bounce of 10 handles. However, this bounce was met by passive sellers who were reloading against the FS VWAP, resulting in a downward continuation. This sequence was quite apparent on the Footprint chart, which I will include a snapshot of on Substack worth checking out.
The B-period formed single prints that were left unfilled by the subsequent periods, hinting at the possibility of a traverse of the inside day owing to the failed upside break. The full traverse was completed in F-period, and sellers in turn attempted a downside break in G-period. This test of the highlighted support area ranging from 4125 to 4115, was the most interesting sequence of Friday’s session. We are aware that trading within the support area is not the ideal trade location for initiating new short positions from a contextual standpoint. Additionally, the VIX was simultaneously testing its resistance level of 17.84 (HOD: 17.92). In such a scenario, what we are hoping to witness is precisely what unfolded on Friday - heavy aggressive sellers entering the market, but unable to gain downside traction. This created a great opportunity to step on their neck, especially since a poor low was also established, indicating crowded sellers. A vicious reversal unfolded into the closing session.
The market remains in full consolidation mode, with the daily in a highlighted 6-day balance. Balance rules apply (See Substack for details).
Balance Rules: The general rule is to go with the break of the balance area. Break to the upside (Look above and go), you want to be a buyer. Break to the downside (Look below and go), you want to be a seller. Monitor for continuation (Acceptance) or lack thereof. Lack of continuation (Failed breakout / Look above/below and fail), you want to fade and target other side of balance.
It’s worth noting that the lower end of the balance area is weak/poor. Both the upside gap of 4182.25 and the downside gap of 4098.25 have yet to be filled. Remember that the longer a consolidation lasts, the more significant the move out of it tends to be. Check out the Weekly Plan for insights on Balance vs Imbalance and the importance to always adapt.
Going into tomorrow's session, I will observe 4146.
Break and hold above 4146 would target 4160 / 4170 / 4182
Holding below 4146 would target 4125 / 4115 / 4098
Additionally, pay attention to the following VIX levels: 17.94 and 16.12. These levels can provide confirmation of strength or weakness.
Break and hold above 4182 with VIX below 16.12 would confirm strength.
Break and hold below 4098 with VIX above 17.94 would confirm weakness.
Overall, it's important to exercise caution when trading outside of the highlighted yellow levels. A non-cooperative VIX may suggest possible reversals i.e trade setups.
Be sure to check out the Weekly Plan, which provides a broader perspective and highlights significant levels of interest to watch in the coming week.
Disclaimer: Futures and options trading involves a high level of risk, with the potential for substantial losses. The information provided in this newsletter is for informational purposes only and is not intended to be a trade recommendation. It is the responsibility of the reader to make their own investment decisions and they should seek the advice of a qualified securities professional before making any investments. The owners/authors of this newsletter are not certified as registered financial professionals or investment advisers.


great stuff!
Thank you!