
ES Daily Plan | March 31, 2026
Market Context & Key Levels for the Day Ahead

— For new subscribers
The yellow levels highlighted at the bottom left of the chart are the primary intraday levels I focus on. To avoid impulsive decisions at poor trade locations, I follow a simple but effective rule: exercise caution when initiating trades outside of these yellow levels.
This means I’m cautious about chasing longs above the Final Upside Target (FUT) and shorts below the Final Downside Target (FDT). It’s important to understand that not chasing does not imply initiating a trade in the opposite direction, discipline over impulse.
Be sure to review the Weekly Plan for a broader perspective, key levels, and market expectations for the week ahead.

Contextual Analysis & Plan
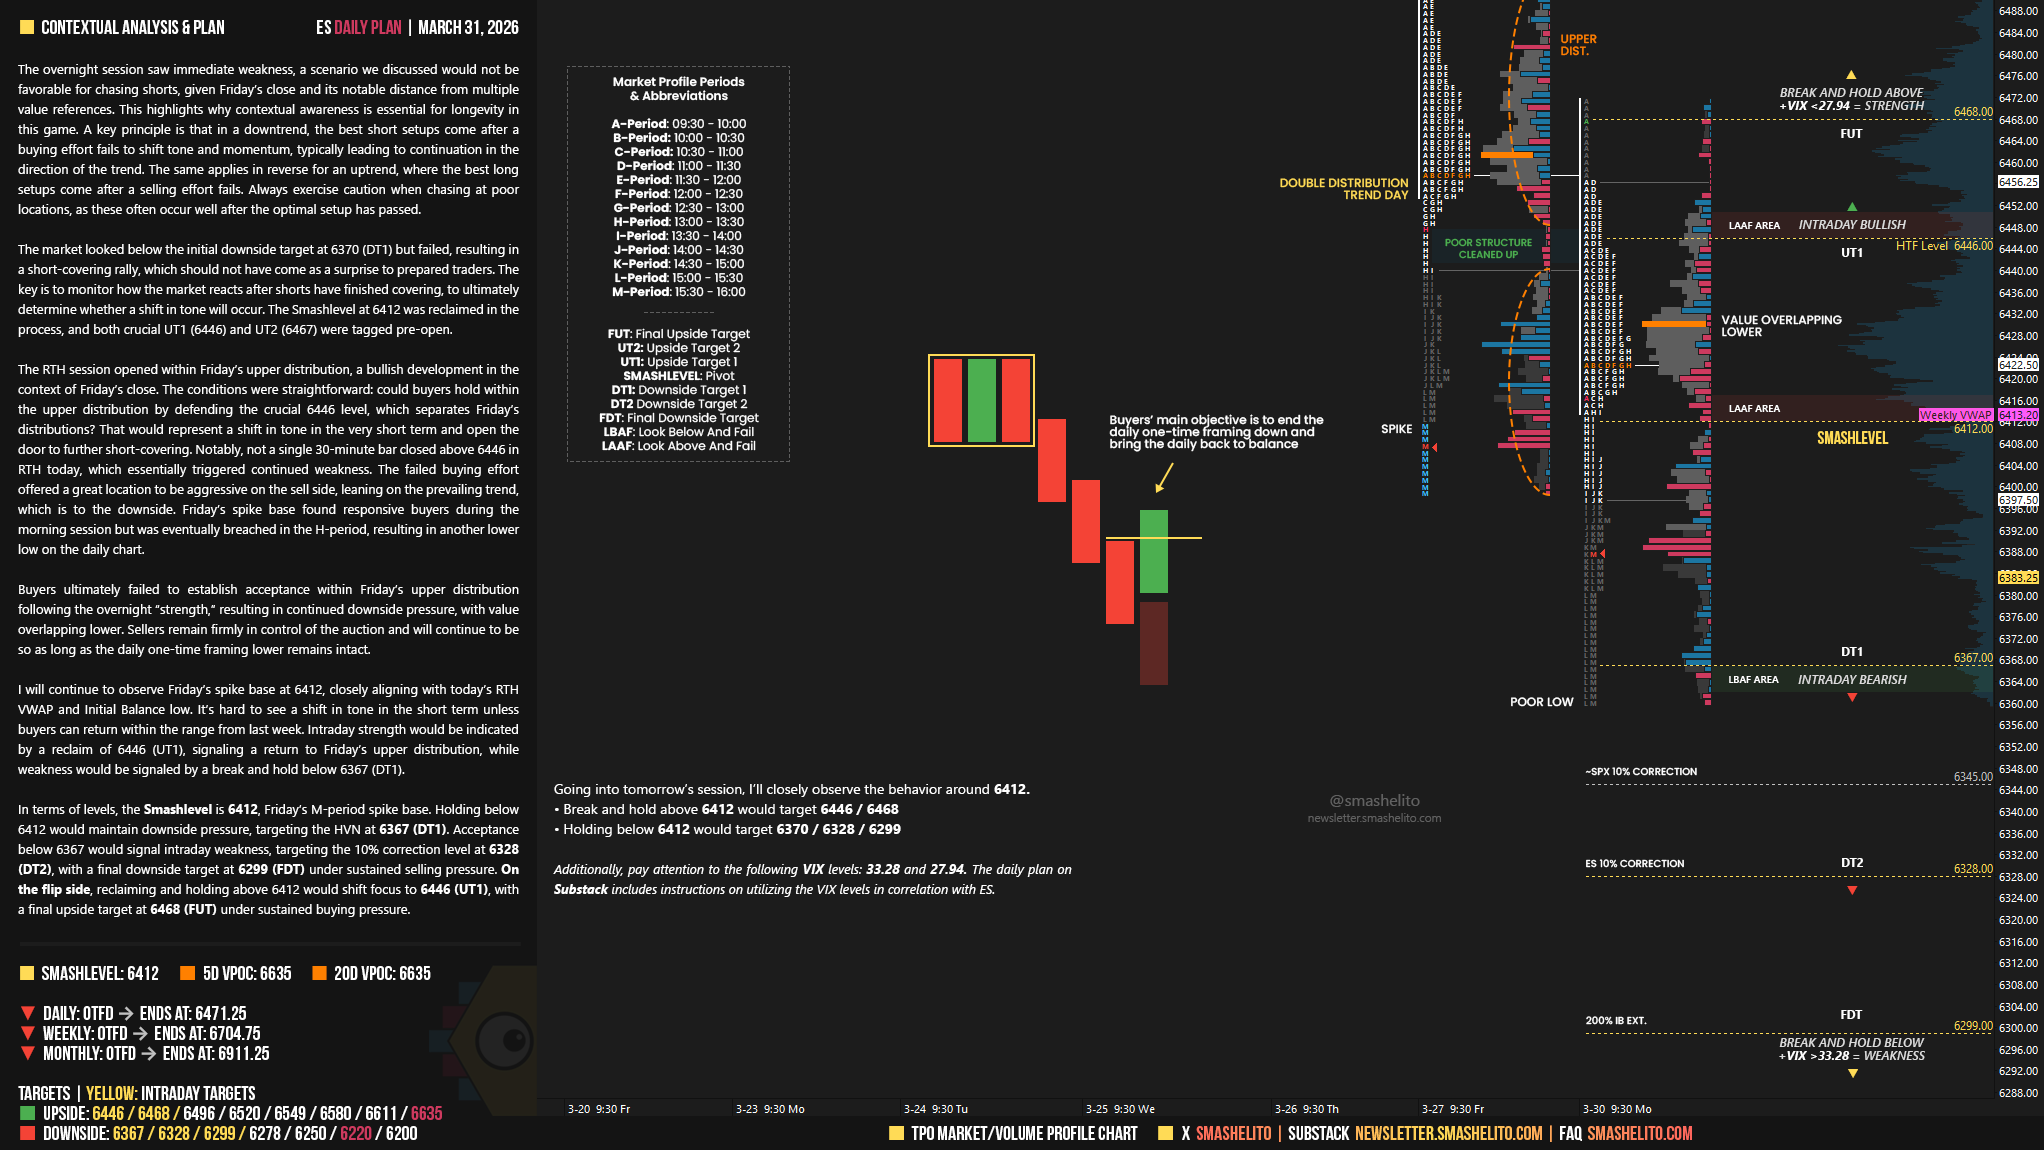
The overnight session saw immediate weakness, a scenario we discussed would not be favorable for chasing shorts, given Friday’s close and its notable distance from multiple value references. This highlights why contextual awareness is essential for longevity in this game. A key principle is that in a downtrend, the best short setups come after a buying effort fails to shift tone and momentum, typically leading to continuation in the direction of the trend. The same applies in reverse for an uptrend, where the best long setups come after a selling effort fails. Always exercise caution when chasing at poor locations, as these often occur well after the optimal setup has passed.
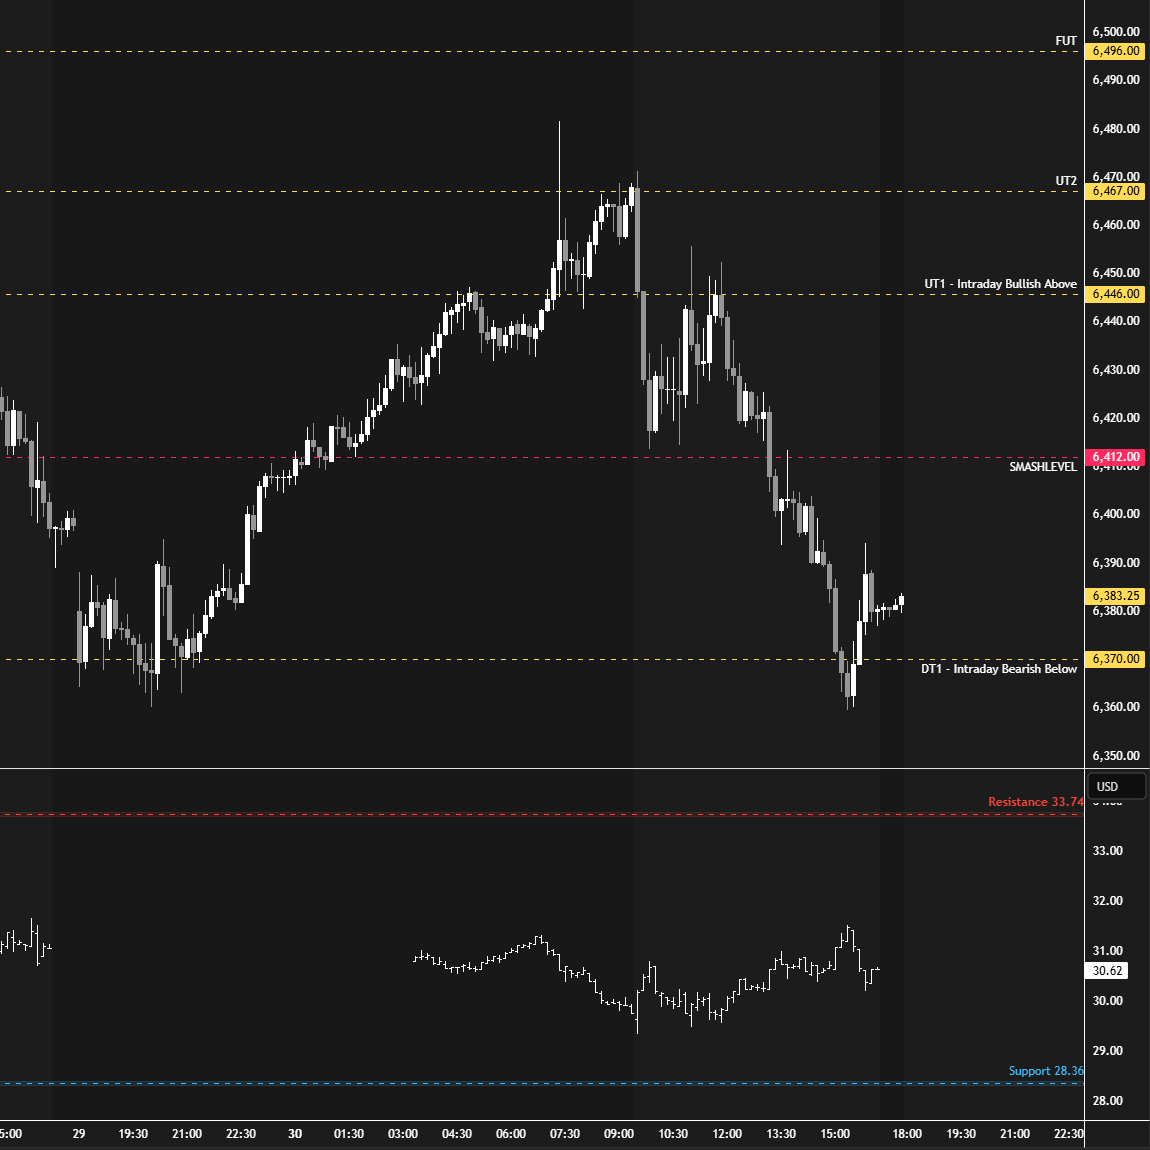
The market looked below the initial downside target at 6370 (DT1) but failed, resulting in a short-covering rally, which should not have come as a surprise to prepared traders. The key is to monitor how the market reacts after shorts have finished covering, to ultimately determine whether a shift in tone will occur. The Smashlevel at 6412 was reclaimed in the process, and both crucial UT1 (6446) and UT2 (6467) were tagged pre-open.
The RTH session opened within Friday’s upper distribution, a bullish development in the context of Friday’s close. The conditions were straightforward: could buyers hold within the upper distribution by defending the crucial 6446 level, which separates Friday’s distributions? That would represent a shift in tone in the very short term and open the door to further short-covering. Notably, not a single 30-minute bar closed above 6446 in RTH today, which essentially triggered continued weakness. The failed buying effort offered a great location to be aggressive on the sell side, leaning on the prevailing trend, which is to the downside. Friday’s spike base found responsive buyers during the morning session but was eventually breached in the H-period, resulting in another lower low on the daily chart.
Buyers ultimately failed to establish acceptance within Friday’s upper distribution following the overnight “strength,” resulting in continued downside pressure, with value overlapping lower. Sellers remain firmly in control of the auction and will continue to be so as long as the daily one-time framing lower remains intact.
I will continue to observe Friday’s spike base at 6412, closely aligning with today’s RTH VWAP and Initial Balance low. It’s hard to see a shift in tone in the short term unless buyers can return within the range from last week.
Intraday strength would be indicated by a reclaim of 6446 (UT1), signaling a return to Friday’s upper distribution, while weakness would be signaled by a break and hold below 6367 (DT1).
In terms of levels, the Smashlevel is 6412, Friday’s M-period spike base. Holding below 6412 would maintain downside pressure, targeting the HVN at 6367 (DT1). Acceptance below 6367 would signal intraday weakness, targeting the 10% correction level at 6328 (DT2), with a final downside target at 6299 (FDT) under sustained selling pressure.
On the flip side, reclaiming and holding above 6412 would shift focus to 6446 (UT1), with a final upside target at 6468 (FUT) under sustained buying pressure.
Levels of Interest
Going into tomorrow’s session, I’ll closely observe the behavior around 6412.
Break and hold above 6412 would target 6446 / 6468
Holding below 6412 would target 6370 / 6328 / 6299
Additionally, pay attention to the following VIX levels: 33.28 and 27.94. These levels can provide confirmation of strength or weakness.
Break and hold above 6468 with VIX below 27.94 would confirm strength.
Break and hold below 6299 with VIX above 33.28 would confirm weakness.
Overall, it's important to exercise caution when trading outside of the highlighted yellow levels. A non-cooperative VIX may suggest possible reversals i.e trade setups.
TY Smashelito
thank you for the level