
ES Daily Plan | March 30, 2026
Market Context & Key Levels for the Day Ahead

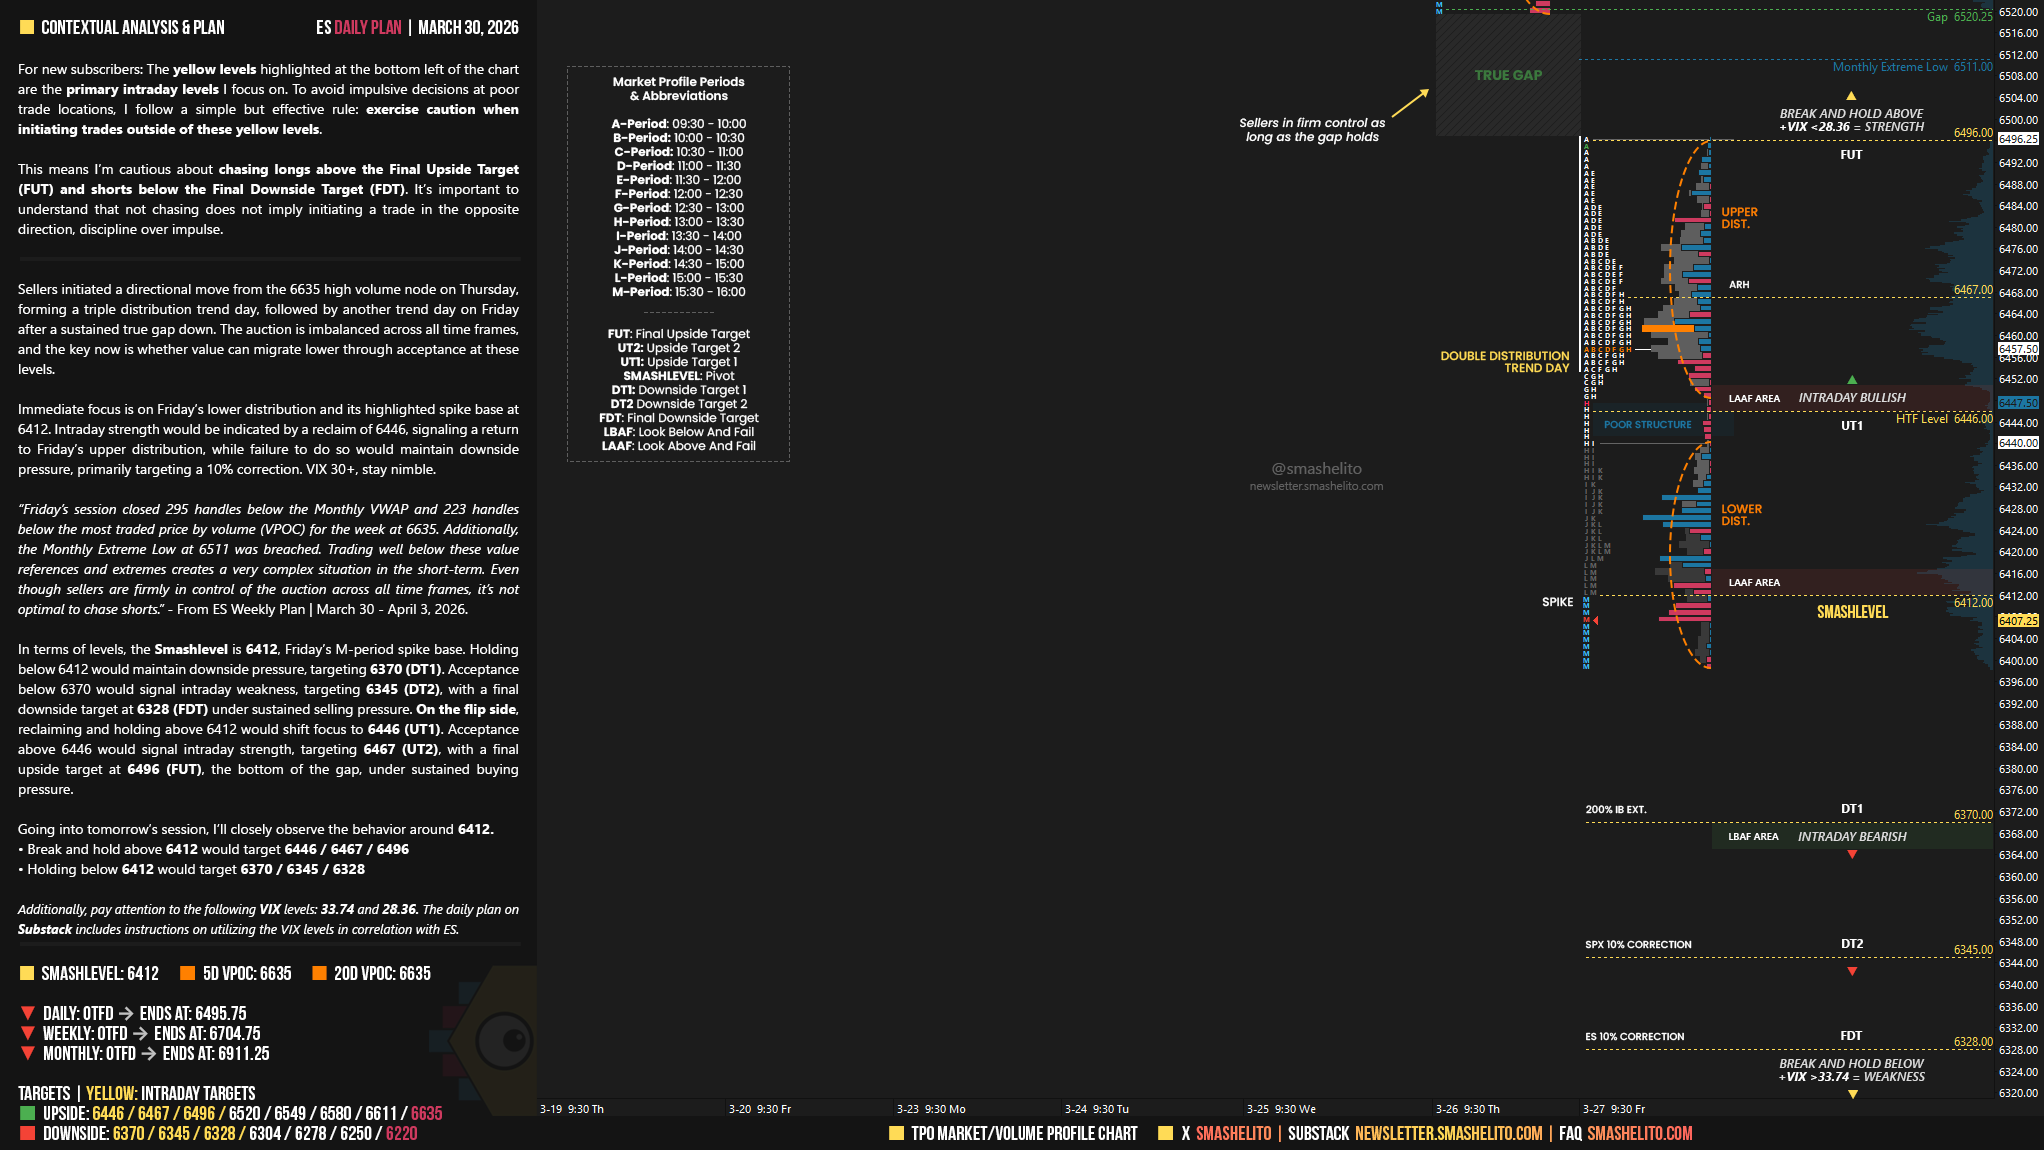
— For new subscribers
The yellow levels highlighted at the bottom left of the chart are the primary intraday levels I focus on. To avoid impulsive decisions at poor trade locations, I follow a simple but effective rule: exercise caution when initiating trades outside of these yellow levels.
This means I’m cautious about chasing longs above the Final Upside Target (FUT) and shorts below the Final Downside Target (FDT). It’s important to understand that not chasing does not imply initiating a trade in the opposite direction, discipline over impulse.
Be sure to review the Weekly Plan for a broader perspective, key levels, and market expectations for the week ahead.

Contextual Analysis & Plan
Sellers initiated a directional move from the 6635 high volume node on Thursday, forming a triple distribution trend day, followed by another trend day on Friday after a sustained true gap down. The auction is imbalanced across all time frames, and the key now is whether value can migrate lower through acceptance at these levels.
Immediate focus is on Friday’s lower distribution and its highlighted spike base at 6412. Intraday strength would be indicated by a reclaim of 6446, signaling a return to Friday’s upper distribution, while failure to do so would maintain downside pressure, primarily targeting a 10% correction. VIX 30+, stay nimble.
In terms of levels, the Smashlevel is 6412, Friday’s M-period spike base. Holding below 6412 would maintain downside pressure, targeting 6370 (DT1). Acceptance below 6370 would signal intraday weakness, targeting 6345 (DT2), with a final downside target at 6328 (FDT) under sustained selling pressure.
On the flip side, reclaiming and holding above 6412 would shift focus to 6446 (UT1). Acceptance above 6446 would signal intraday strength, targeting 6467 (UT2), with a final upside target at 6496 (FUT), the bottom of the gap, under sustained buying pressure.
Levels of Interest
Going into tomorrow’s session, I’ll closely observe the behavior around 6412.
Break and hold above 6412 would target 6446 / 6467 / 6496
Holding below 6412 would target 6370 / 6345 / 6328
Additionally, pay attention to the following VIX levels: 33.74 and 28.36. These levels can provide confirmation of strength or weakness.
Break and hold above 6496 with VIX below 28.36 would confirm strength.
Break and hold below 6328 with VIX above 33.74 would confirm weakness.
Overall, it's important to exercise caution when trading outside of the highlighted yellow levels. A non-cooperative VIX may suggest possible reversals i.e trade setups.
When you miss the big R overnight high rejection, knowing that Smash will open with it on his 3/31 Daily Plan RTH recap, and now you’re SOH waiting and watching at the SL 😭🫠
Thanks Smash, just wondering what ARH means on 6467?