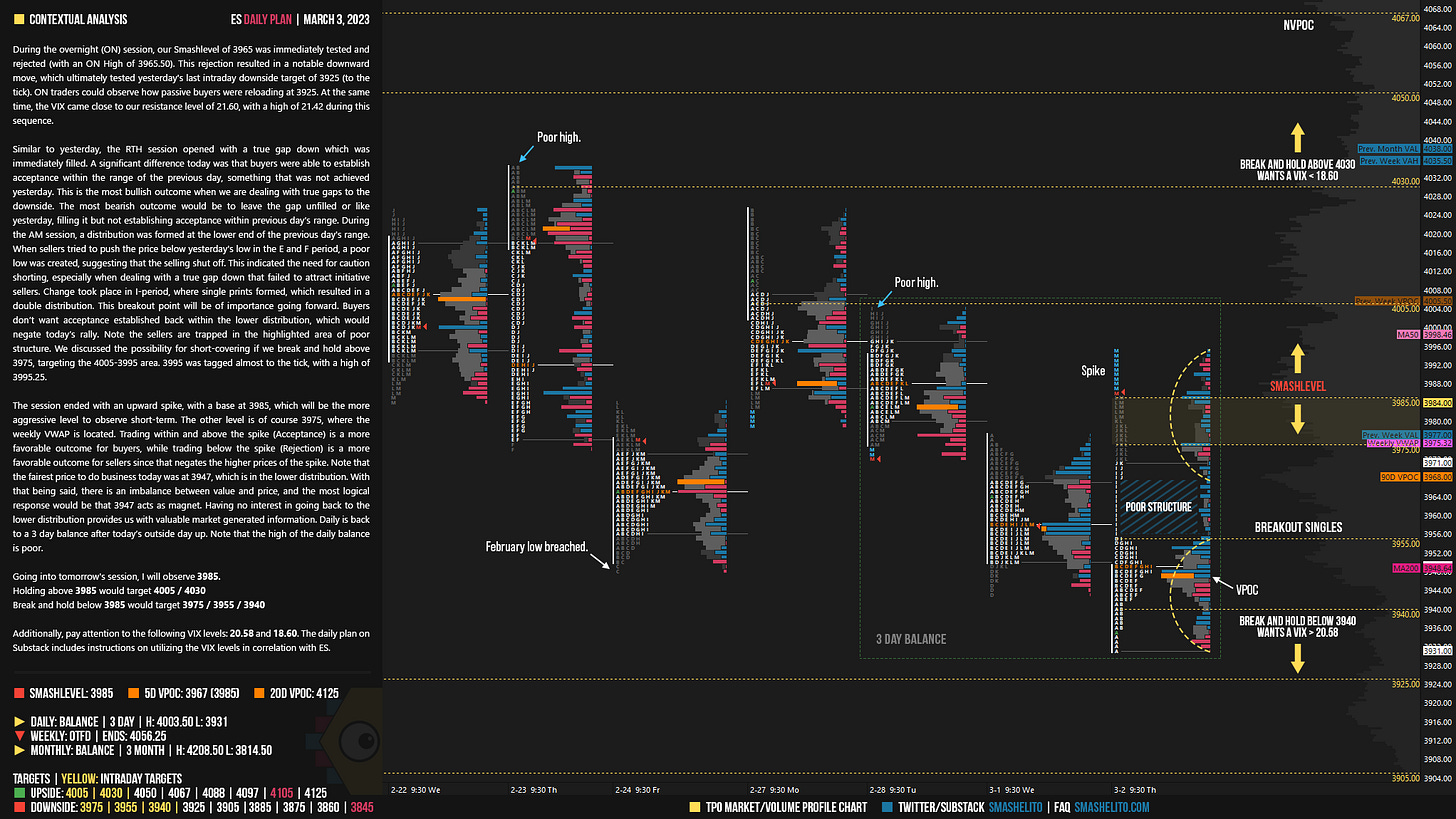
ES Daily Plan | March 3, 2023
The lack of initiative sellers after another true gap down attracted responsive activity.
The session ended with an upward spike, with a base at 3985, which will be the more aggressive level to observe short-term.
Contextual Analysis
During the overnight (ON) session, our Smashlevel of 3965 was immediately tested and rejected (with an ON High of 3965.50). This rejection resulted in a notable downward move, which ultimately tested yesterday's last intraday downside target of 3925 (to the tick). ON traders could observe how passive buyers were reloading at 3925. At the same time, the VIX came close to our resistance level of 21.60, with a high of 21.42 during this sequence.
Similar to yesterday, the RTH session opened with a true gap down which was immediately filled. A significant difference today was that buyers were able to establish acceptance within the range of the previous day, something that was not achieved yesterday. This is the most bullish outcome when we are dealing with true gaps to the downside. The most bearish outcome would be to leave the gap unfilled or like yesterday, filling it but not establishing acceptance within previous day’s range. During the AM session, a distribution was formed at the lower end of the previous day's range. When sellers tried to push the price below yesterday's low in the E and F period, a poor low was created, suggesting that the selling shut off. This indicated the need for caution shorting, especially when dealing with a true gap down that failed to attract initiative sellers. Change took place in I-period, where single prints formed, which resulted in a double distribution. This breakout point will be of importance going forward. Buyers don’t want acceptance established back within the lower distribution, which would negate today’s rally. Note the sellers are trapped in the highlighted area of poor structure. We discussed the possibility for short-covering if we break and hold above 3975, targeting the 4005-3995 area. 3995 was tagged almost to the tick, with a high of 3995.25.
The session ended with an upward spike, with a base at 3985, which will be the more aggressive level to observe short-term. The other level is of course 3975, where the weekly VWAP is located. Trading within and above the spike (Acceptance) is a more favorable outcome for buyers, while trading below the spike (Rejection) is a more favorable outcome for sellers since that negates the higher prices of the spike. Note that the fairest price to do business today was at 3947, which is in the lower distribution. With that being said, there is an imbalance between value and price, and the most logical response would be that 3947 acts as magnet. Having no interest in going back to the lower distribution provides us with valuable market generated information. Daily is back to a 3 day balance after today’s outside day up. Note that the high of the daily balance is poor.
Going into tomorrow's session, I will observe 3985.
Holding above 3985 would target 4005 / 4030
Break and hold below 3985 would target 3975 / 3955 / 3940
Additionally, pay attention to the following VIX levels: 20.58 and 18.60. These levels can provide confirmation of strength or weakness.
Break and hold above 4030 with VIX below 18.60 would confirm strength.
Break and hold below 3940 with VIX above 20.58 would confirm weakness.
Overall, it's important to exercise caution when trading outside of the highlighted yellow levels. A non-cooperative VIX may suggest possible reversals i.e trade setups.
Be sure to check out the Weekly Plan, which provides a broader perspective and highlights significant levels of interest to watch in the coming week.
Disclaimer: Futures and options trading involves a high level of risk, with the potential for substantial losses. The information provided in this newsletter is for informational purposes only and is not intended to be a trade recommendation. It is the responsibility of the reader to make their own investment decisions and they should seek the advice of a qualified securities professional before making any investments. The owners/authors of this newsletter are not certified as registered financial professionals or investment advisers. Twitter: @smashelito | FAQ: smashelito.com


Very precise analysis as usual. Do you think today's recovery was mostly a vol selling day? VIX and ES charts are literally forming an X if overlaid
Very informative article! Thank you!