ES Daily Plan | March 23, 2023
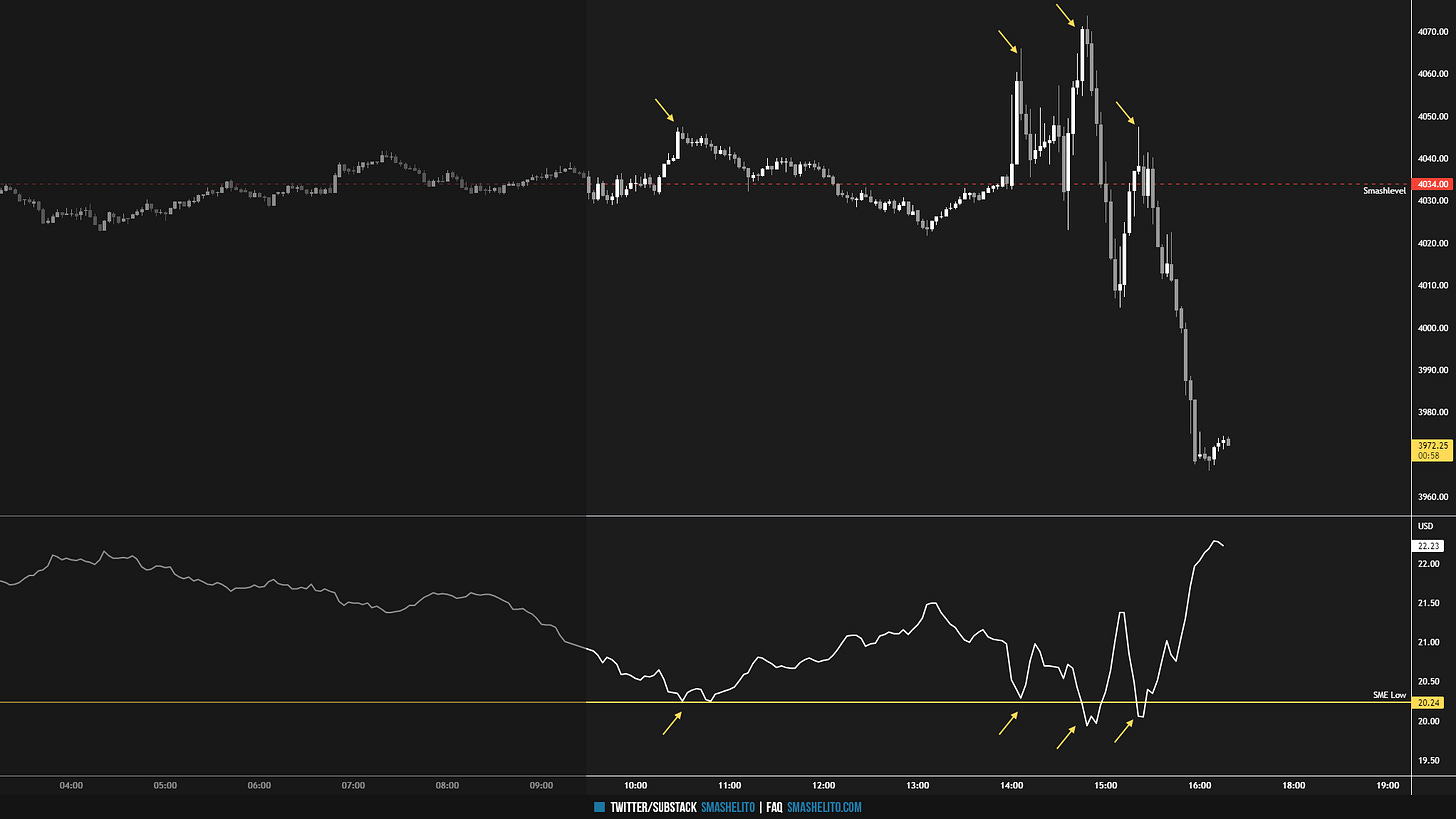
As usual, the market underwent volatility during FOMC. Today’s session resulted in an outside day down, with a pretty vicious downward spike as the M-period made a new daily low.
It brings me immense pleasure to share that this newsletter has now surpassed 3000 subscribers. I want to take this opportunity to express my gratitude for your unwavering support and for being a part of this project. Thank you.
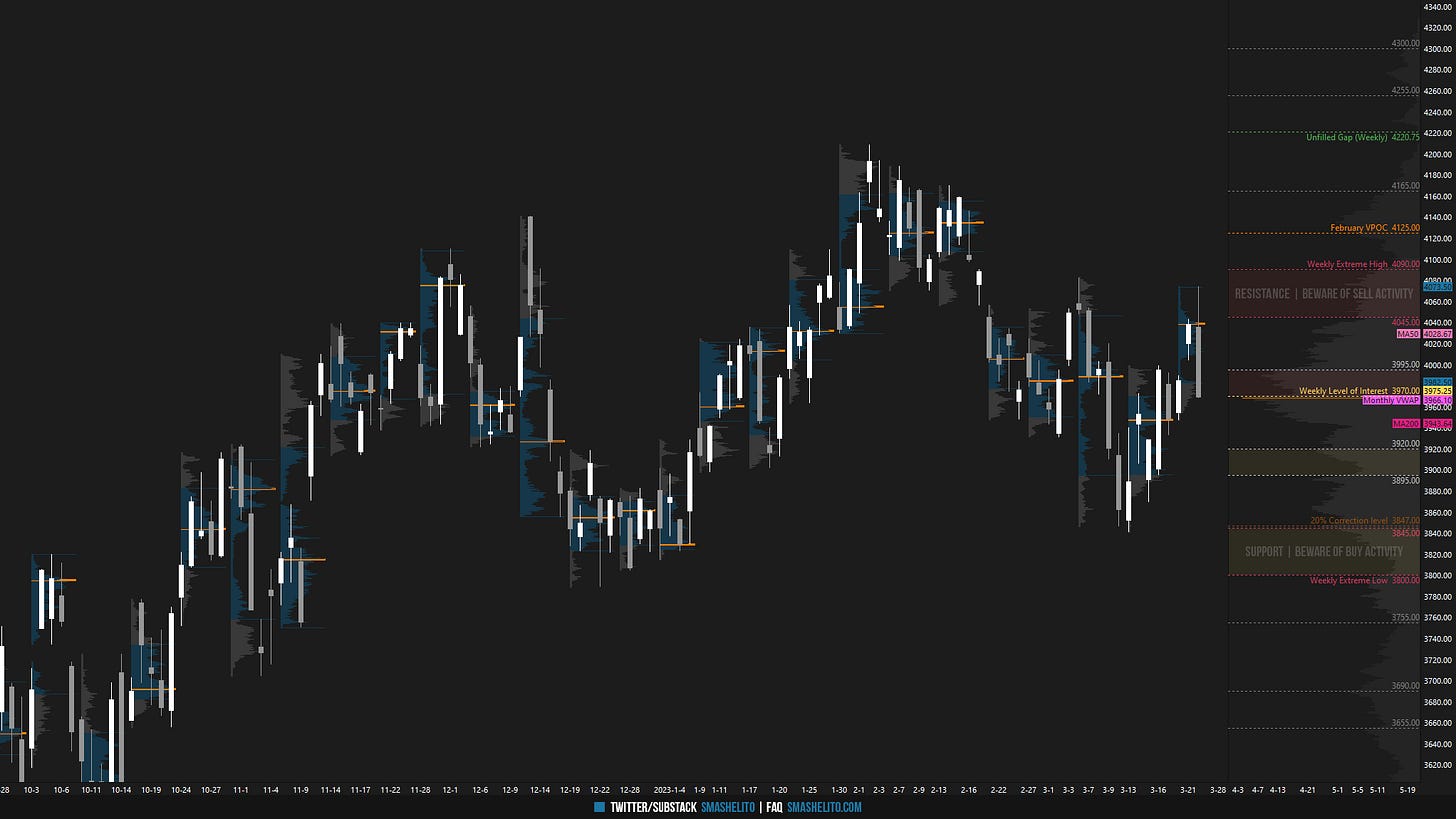
Note the current weekly profile.
Contextual Analysis
During the overnight (ON) session today, the market traded within a narrow range and was relatively uneventful, except for a minor dip in the European session that was quickly bought up by buyers at the prior day's halfback.
The RTH session began trading within the prior day's spike area and remained within a narrow range during the A-period. However, in the B-period, buyers made a significant effort to explore prices above the prior day's high, with a positive delta of 5693. This effort failed heavily as passive sellers were able to absorb the aggressive buying. In other words, the buyers didn’t have size enough to push the price through the limit orders. This is the fundamental principle of orderflow trading, the presence or absence of absorption. Before FOMC, the primary theme was liquidity grabs and reversals, which was illustrated in a visual that I tweeted.
As usual, the market underwent volatility during FOMC. As mentioned yesterday, it’s usually a good idea to go flat 30 minutes before the event and save your mental capital for Thursday and Friday, which are generally much better days to focus on. Today’s upside was capped by the 4069 level, leading to an excess high forming. Is this and end of an auction and the beginning of another? During FOMC, the market was mostly within the range of 4070-4005, but the M-period witnessed a sharp liquidation and filled yesterday’s gap in the process. One interesting observation was that each upward move encountered selling pressure, coinciding with VIX testing the support level of 20.24, which was provided in the previous plan.
Today’s session resulted in an outside day down, with an downward spike as the M-period made a new daily low. The spike base is at 4005, which is a level that buyers need to regain immediately. Trading within and below the spike (Acceptance) is a more favorable outcome for sellers, while trading above the spike (Rejection) is a more favorable outcome for buyers as that negates the lower prices of the spike. I outlined in previous plan that sellers most favorable scenario is a daily close back below 3990, and they got it. Now we need to observe if they can follow-through. The M-period had a negative delta of 18222. The current weekly profile has been added on the chart, and the situation is clear-cut. For buyers to take charge, they must gain acceptance back within the upper distribution, whereas sellers have the upper hand in the short term if trading persists in the lower distribution. The daily has returned to a 2-day balance after breaking yesterday's low.
Observe the updated chart from the Weekly Plan below. That is a pretty vicious rejection from the weekly resistance area.
Going into tomorrow's session, I will observe 3988.
Holding above 3988 would target 4005 / 4022
Break and hold below 3988 would target 3962 / 3940 / 3920
Additionally, pay attention to the following VIX levels: 23.40 and 21.12. These levels can provide confirmation of strength or weakness.
Break and hold above 4022 with VIX below 21.12 would confirm strength.
Break and hold below 3920 with VIX above 23.40 would confirm weakness.
Overall, it's important to exercise caution when trading outside of the highlighted yellow levels. A non-cooperative VIX may suggest possible reversals i.e trade setups.
Be sure to check out the Weekly Plan, which provides a broader perspective and highlights significant levels of interest to watch in the coming week.
Disclaimer: Futures and options trading involves a high level of risk, with the potential for substantial losses. The information provided in this newsletter is for informational purposes only and is not intended to be a trade recommendation. It is the responsibility of the reader to make their own investment decisions and they should seek the advice of a qualified securities professional before making any investments. The owners/authors of this newsletter are not certified as registered financial professionals or investment advisers. Twitter: @smashelito | FAQ: smashelito.com


Congratulations on reaching 3000 subscribers! The quality of the content you provide here is unmatched! I would love to contribute in any way possible to support your work, which I still can't wrap my head around why you do for free.
Congrats man! Seriously you are the master analyst (and trader I assume). This resource has absolutely transformed my trading from mediocre poor consistency to profitable almost every day of the week. Your analysis is probably the best I have ever come across. It honestly changes lives for those who are willing to read it, understand it and apply it. Wish I had of found this years ago! I'm a huge supporter. Would love to be able to contribute one day when my skills catch up to yours. Thanks again, you are changing my life!!!!