ES Daily Plan | March 2, 2023
The volatile price movements persist, punishing traders in either direction if they maintain positions for too long. The monthly is back to balance following several months of forming higher lows.
Contextual Analysis
I'll keep it brief as today's session was relatively quiet. The overnight (ON) session was similar to yesterday's as we saw price exploration below previous day's range before reversing course and returning to yesterday's halfback. The slow upward grind came to an end with a liquidation before the start of the RTH session.
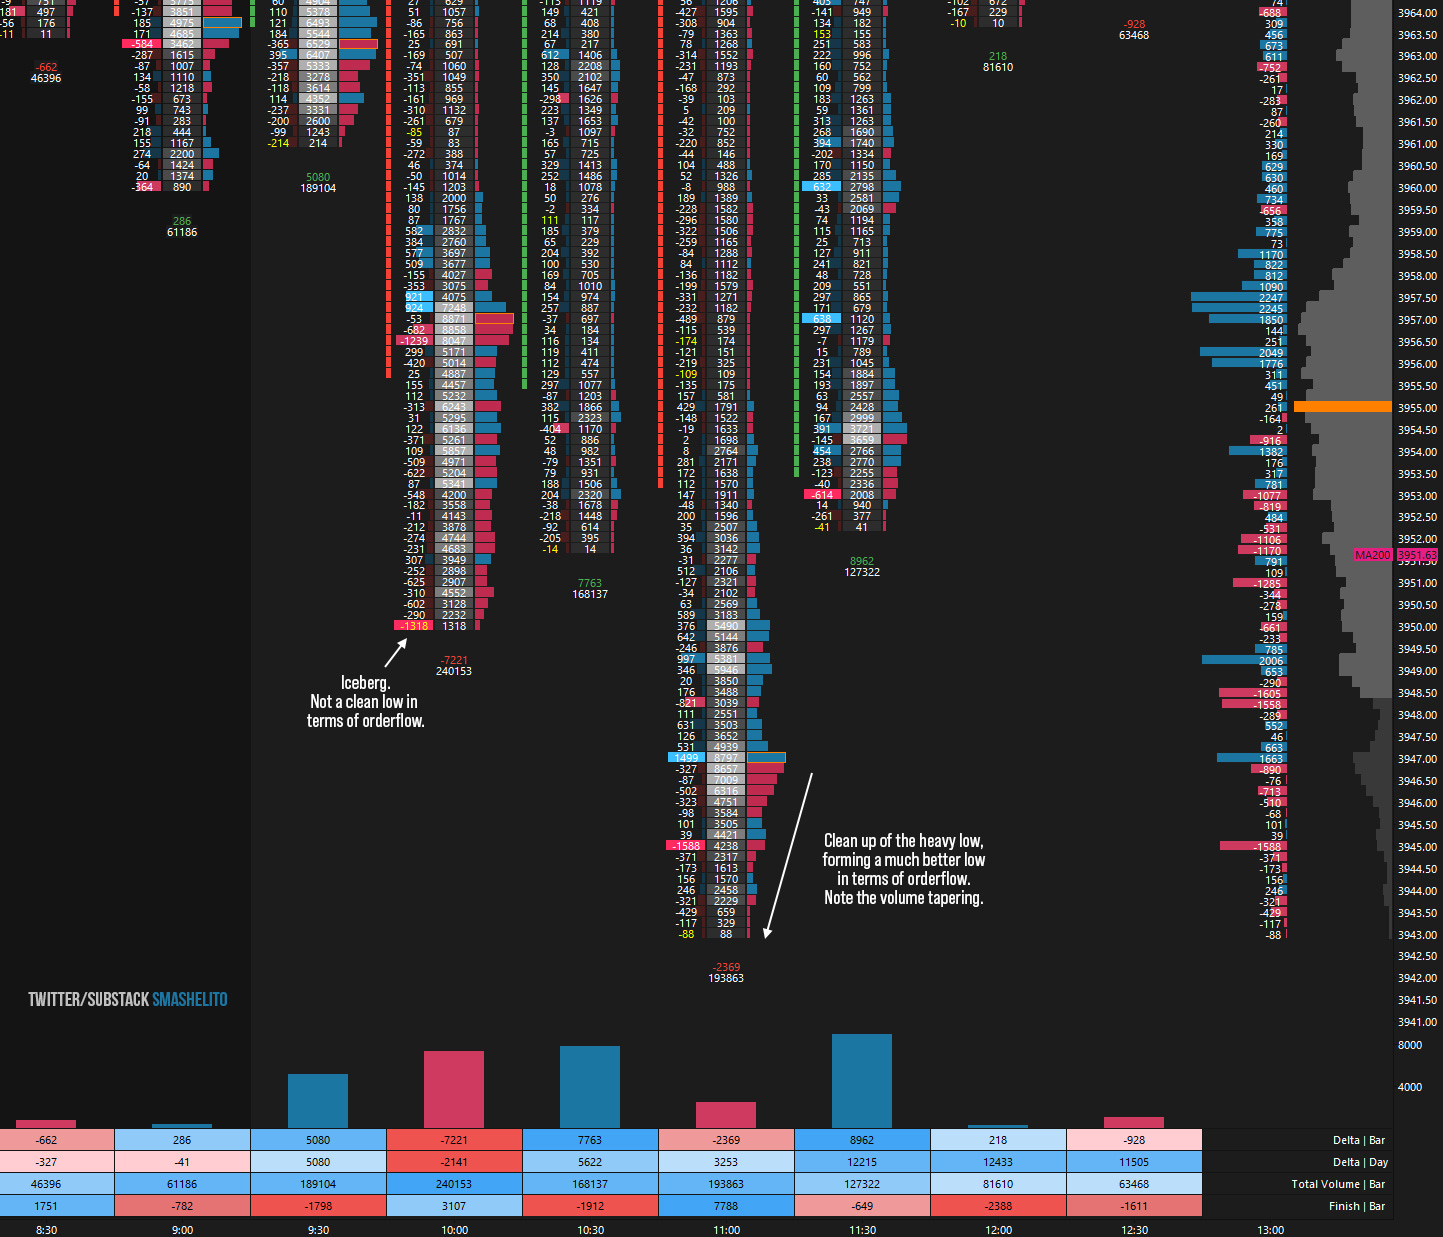
The RTH session opened with a true gap down, which means that the open was completely outside of the previous day’s range. As has been typical recently, the gap was promptly filled. However, buyers were unable to establish acceptance back inside the previous day's range, encountering selling activity near the Smashlevel of 3975. The high of the day was at 3976.50. During the initial balance, there was an iceberg at 3950 absorbing the aggressive sellers who didn’t have size enough to push through the limit orders, resulting in a very nice reversal with pace. If you were participating in that reversal, you are aware that we were rallying off a rather poor low in terms of orderflow. This implies that you should not be overly ambitious with your target expectations, as the likelihood of revisiting that low was fairly high. The reversal tested the previous day's low and again faced selling pressure.
We saw a range extension to the downside in D-period which was significant as sellers managed to take out the February low of 3947.50, cleaning up the poor low in the process. This brings the monthly back to balance following several months of forming higher lows. However, sellers failed to see any meaningful follow through to the downside having the MA200 in close connection. This resulted in an excess being formed, signifying a notably superior low to the preceding one from the initial balance. The third attempt to establish acceptance above 3975 was also unsuccessful, resulting in a revisit of the excess low, where buying interest emerged during the closing session. The volatile price movements persist, punishing traders in either direction if they maintain positions for too long.
In my analysis, I view the daily as one time framing down, since we breached the multi-day balance low. As previously stated, the monthly has returned to a 3 month balance, which is a noteworthy accomplishment for sellers. However, we ended the day back within February's range and above the MA200. Sellers are maintaining control below the 3975-3965 area, aiming to continue the pattern of lower highs and lower lows. If we break and hold above, there is the possibility of short-covering to the next resistance zone of 3995-4005, where selling activity can be expected. It's worth noting that we had positive delta today despite printing a lower low.
Going into tomorrow's session, I will observe 3965.
Break and hold above 3965 would target 3975 / 3995 / 4005
Holding below 3965 would target 3945 / 3925 / 3905
Additionally, pay attention to the following VIX levels: 21.60 and 19.56. These levels can provide confirmation of strength or weakness.
Break and hold above 4005 with VIX below 19.56 would confirm strength.
Break and hold below 3905 with VIX above 21.60 would confirm weakness.
Overall, it's important to exercise caution when trading outside of the highlighted yellow levels. A non-cooperative VIX may suggest possible reversals i.e trade setups.
Be sure to check out the Weekly Plan, which provides a broader perspective and highlights significant levels of interest to watch in the coming week.
Disclaimer: Futures and options trading involves a high level of risk, with the potential for substantial losses. The information provided in this newsletter is for informational purposes only and is not intended to be a trade recommendation. It is the responsibility of the reader to make their own investment decisions and they should seek the advice of a qualified securities professional before making any investments. The owners/authors of this newsletter are not certified as registered financial professionals or investment advisers. Twitter: @smashelito | FAQ: smashelito.com


What do you use for your chart?