
ES Daily Plan | March 13, 2026
Market Context & Key Levels for the Day Ahead

— For new subscribers
The yellow levels highlighted at the bottom left of the chart are the primary intraday levels I focus on. To avoid impulsive decisions at poor trade locations, I follow a simple but effective rule: exercise caution when initiating trades outside of these yellow levels.
This means I’m cautious about chasing longs above the Final Upside Target (FUT) and shorts below the Final Downside Target (FDT). It’s important to understand that not chasing does not imply initiating a trade in the opposite direction — discipline over impulse.
Be sure to review the Weekly Plan for a broader perspective, key levels, and market expectations for the week ahead.

Contextual Analysis & Plan
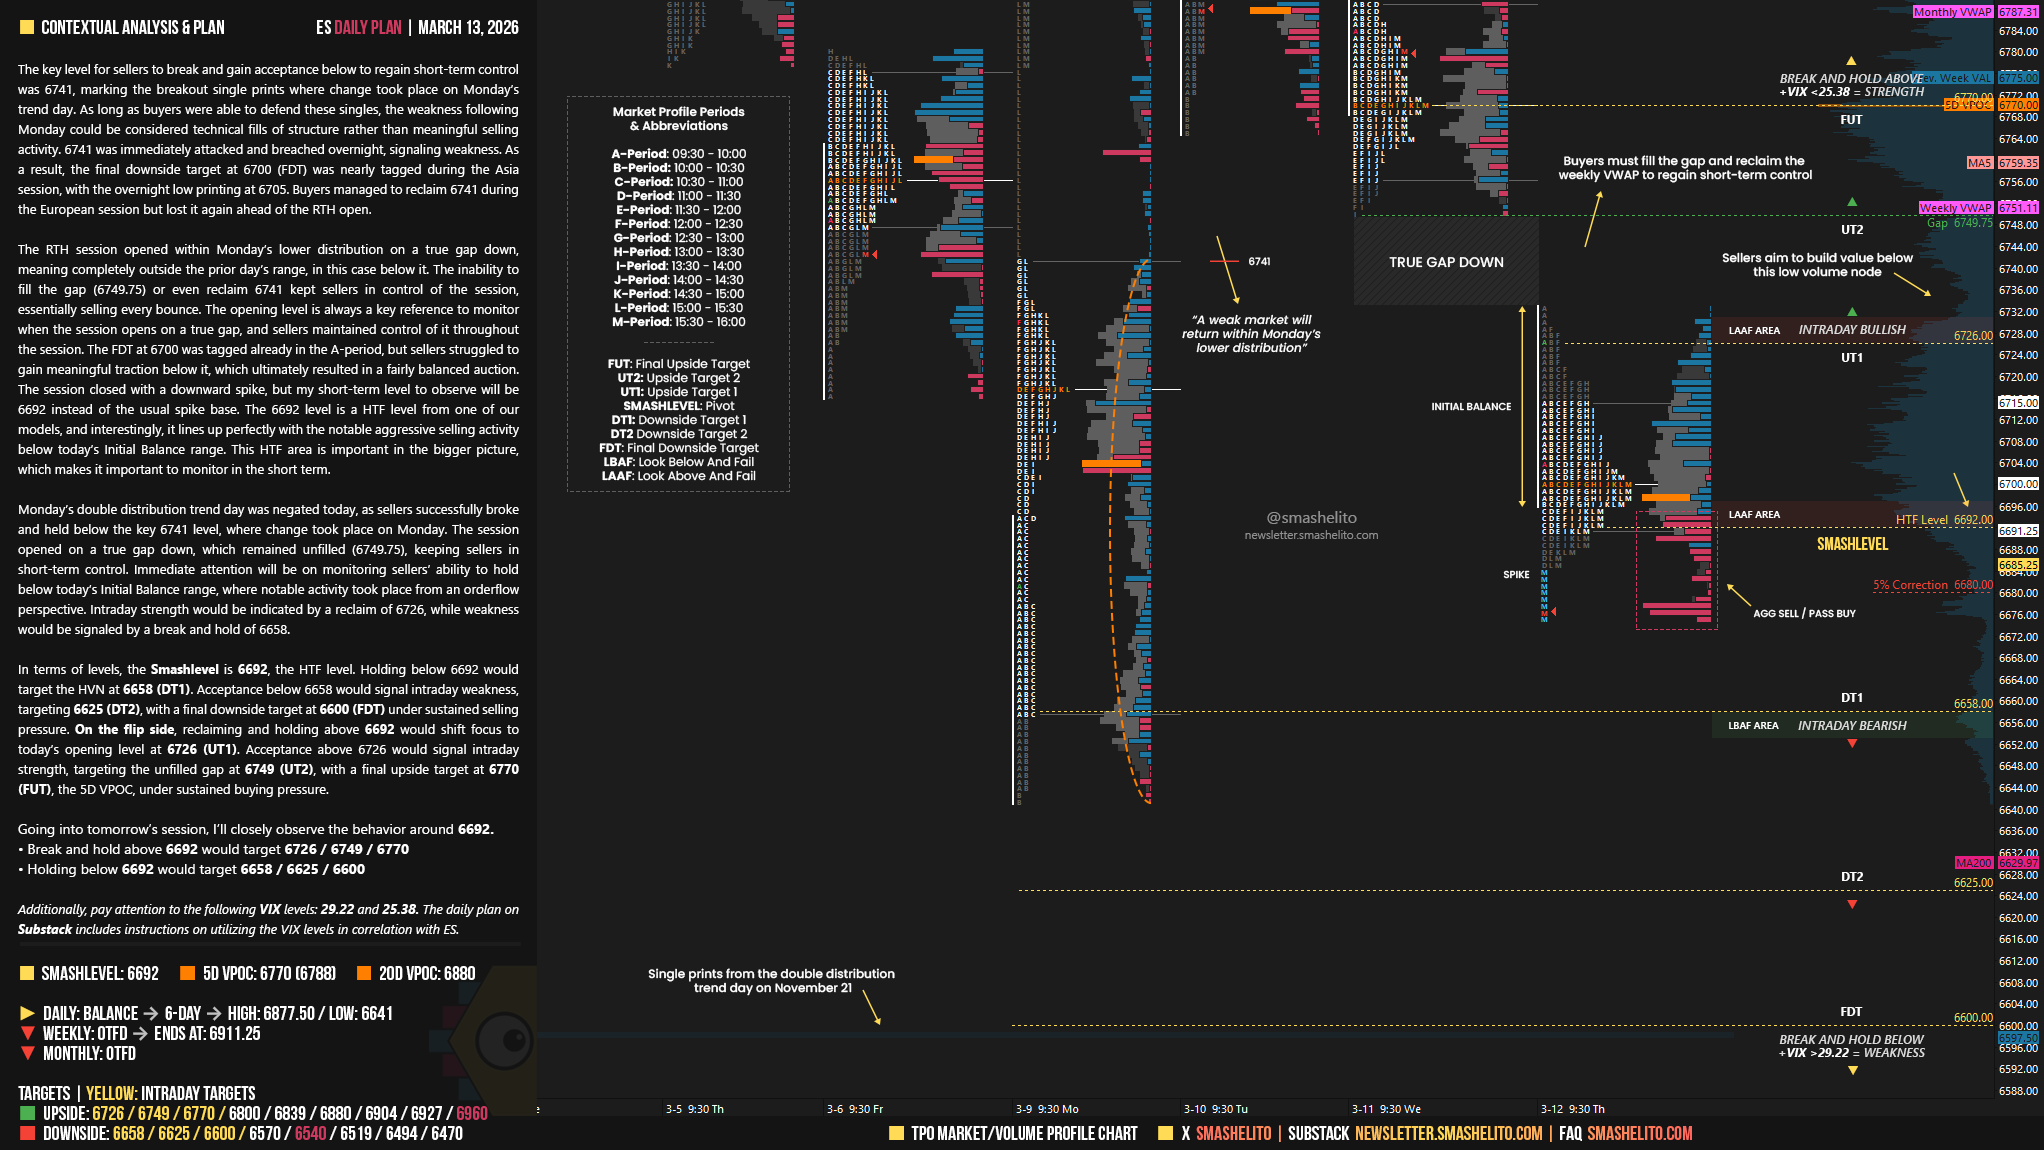
The key level for sellers to break and gain acceptance below to regain short-term control was 6741, marking the breakout single prints where change took place on Monday’s trend day. As long as buyers were able to defend these singles, the weakness following Monday could be considered technical fills of structure rather than meaningful selling activity. 6741 was immediately attacked and breached overnight, signaling weakness. As a result, the final downside target at 6700 (FDT) was nearly tagged during the Asia session, with the overnight low printing at 6705. Buyers managed to reclaim 6741 during the European session but lost it again ahead of the RTH open.
The RTH session opened within Monday’s lower distribution on a true gap down, meaning completely outside the prior day’s range, in this case below it. The inability to fill the gap (6749.75) or even reclaim 6741 kept sellers in control of the session, essentially selling every bounce. The opening level is always a key reference to monitor when the session opens on a true gap, and sellers maintained control of it throughout the session. The FDT at 6700 was tagged already in the A-period, but sellers struggled to gain meaningful traction below it, which ultimately resulted in a fairly balanced auction. The session closed with a downward spike, but my short-term level to observe will be 6692 instead of the usual spike base. The 6692 level is a HTF level from one of our models, and interestingly, it lines up perfectly with the notable aggressive selling activity below today’s Initial Balance range. This HTF area is important in the bigger picture, which makes it important to monitor in the short term.
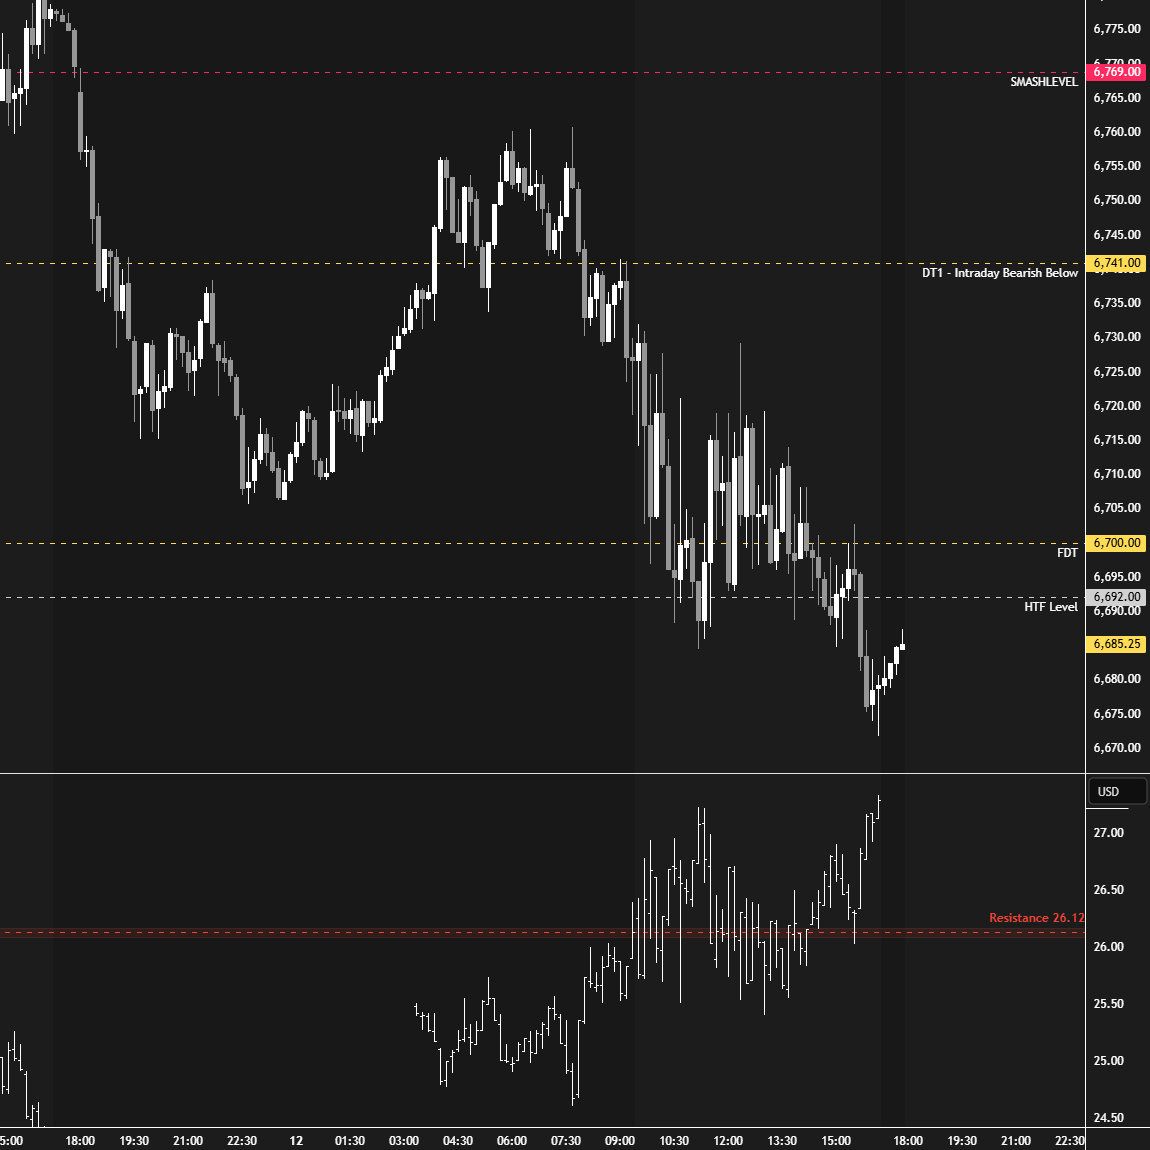
Monday’s double distribution trend day was negated today, as sellers successfully broke and held below the key 6741 level, where change took place on Monday. The session opened on a true gap down, which remained unfilled (6749.75), keeping sellers in short-term control.
Immediate attention will be on monitoring sellers’ ability to hold below today’s Initial Balance range, where notable activity took place from an orderflow perspective. Intraday strength would be indicated by a reclaim of 6726, while weakness would be signaled by a break and hold of 6658.
In terms of levels, the Smashlevel is 6692, the HTF level. Holding below 6692 would target the HVN at 6658 (DT1). Acceptance below 6658 would signal intraday weakness, targeting 6625 (DT2), with a final downside target at 6600 (FDT) under sustained selling pressure.
On the flip side, reclaiming and holding above 6692 would shift focus to today’s opening level at 6726 (UT1). Acceptance above 6726 would signal intraday strength, targeting the unfilled gap at 6749 (UT2), with a final upside target at 6770 (FUT), the 5D VPOC, under sustained buying pressure.
Levels of Interest
Going into tomorrow’s session, I’ll closely observe the behavior around 6692.
Break and hold above 6692 would target 6726 / 6749 / 6770
Holding below 6692 would target 6658 / 6625 / 6600
Additionally, pay attention to the following VIX levels: 29.22 and 25.38. These levels can provide confirmation of strength or weakness.
Break and hold above 6770 with VIX below 25.38 would confirm strength.
Break and hold below 6600 with VIX above 29.22 would confirm weakness.
Overall, it's important to exercise caution when trading outside of the highlighted yellow levels. A non-cooperative VIX may suggest possible reversals i.e trade setups.
I really appreciate all the work behind this, tell me when we have to pay, Smash!
Thanks Smash!