
ES Daily Plan | March 12, 2026
Market Context & Key Levels for the Day Ahead

— For new subscribers
The yellow levels highlighted at the bottom left of the chart are the primary intraday levels I focus on. To avoid impulsive decisions at poor trade locations, I follow a simple but effective rule: exercise caution when initiating trades outside of these yellow levels.
This means I’m cautious about chasing longs above the Final Upside Target (FUT) and shorts below the Final Downside Target (FDT). It’s important to understand that not chasing does not imply initiating a trade in the opposite direction — discipline over impulse.
Be sure to review the Weekly Plan for a broader perspective, key levels, and market expectations for the week ahead.

Contextual Analysis & Plan
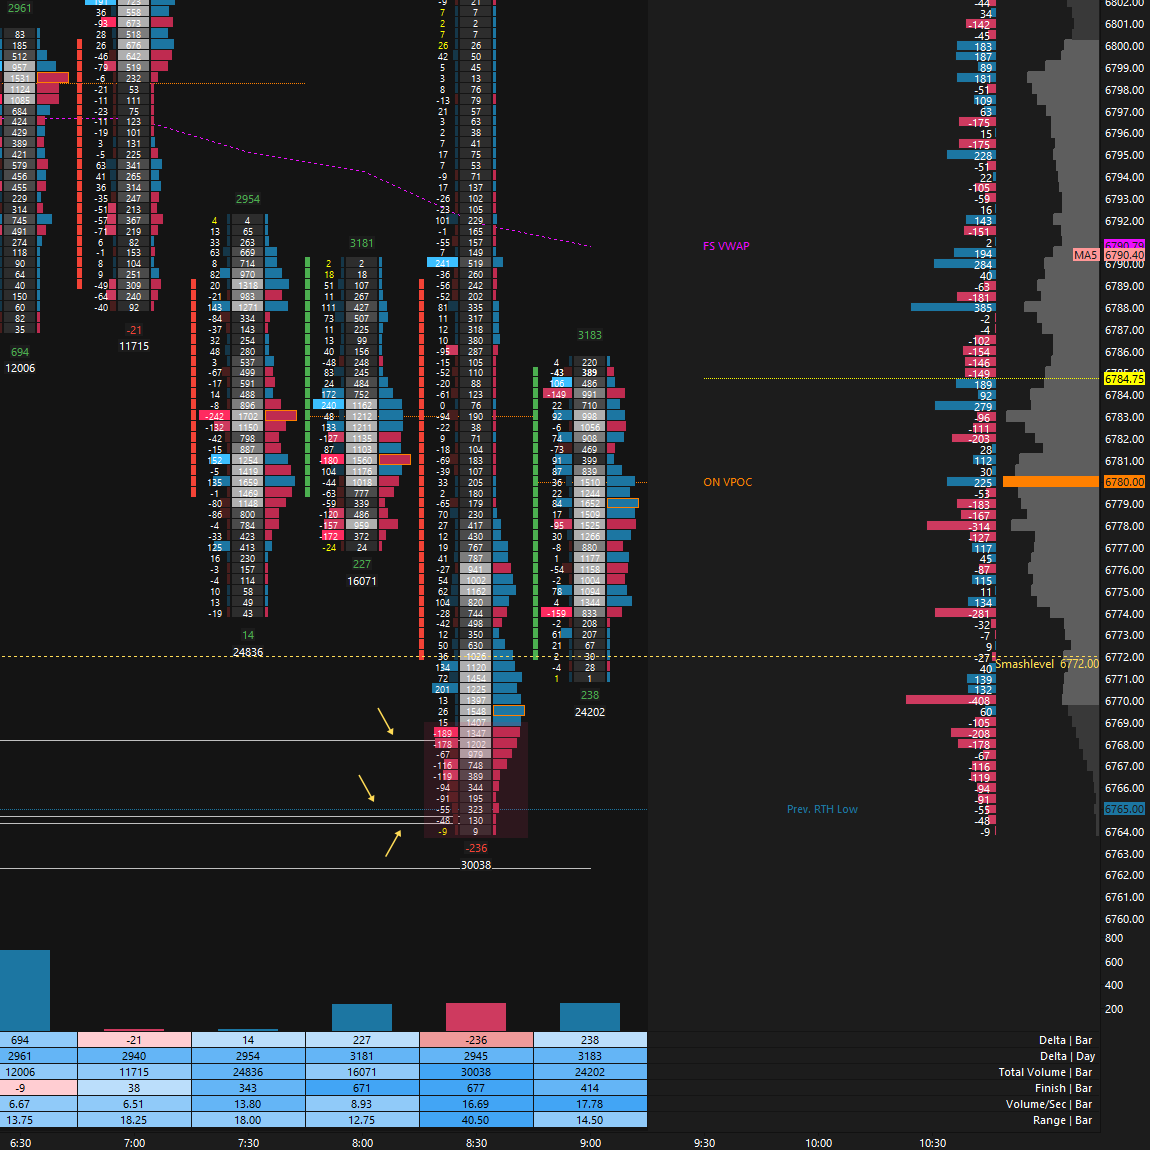
The initial part of the overnight session was marked by strength, with buyers reclaiming 6806 (UT1). This reclaim led to a push higher; however, it did not reach the next level of interest at 6839, with an overnight high printing at 6822.50. The failure to defend 6806 then quickly led to a test of the Smashlevel at 6772, which provided several strong reversals today. The most notable reversals occurred pre-open, when the market swept Tuesday’s low, along with a couple of prior swing lows, before reversing higher. Note the absorption on the Footprint (see Figure 1).
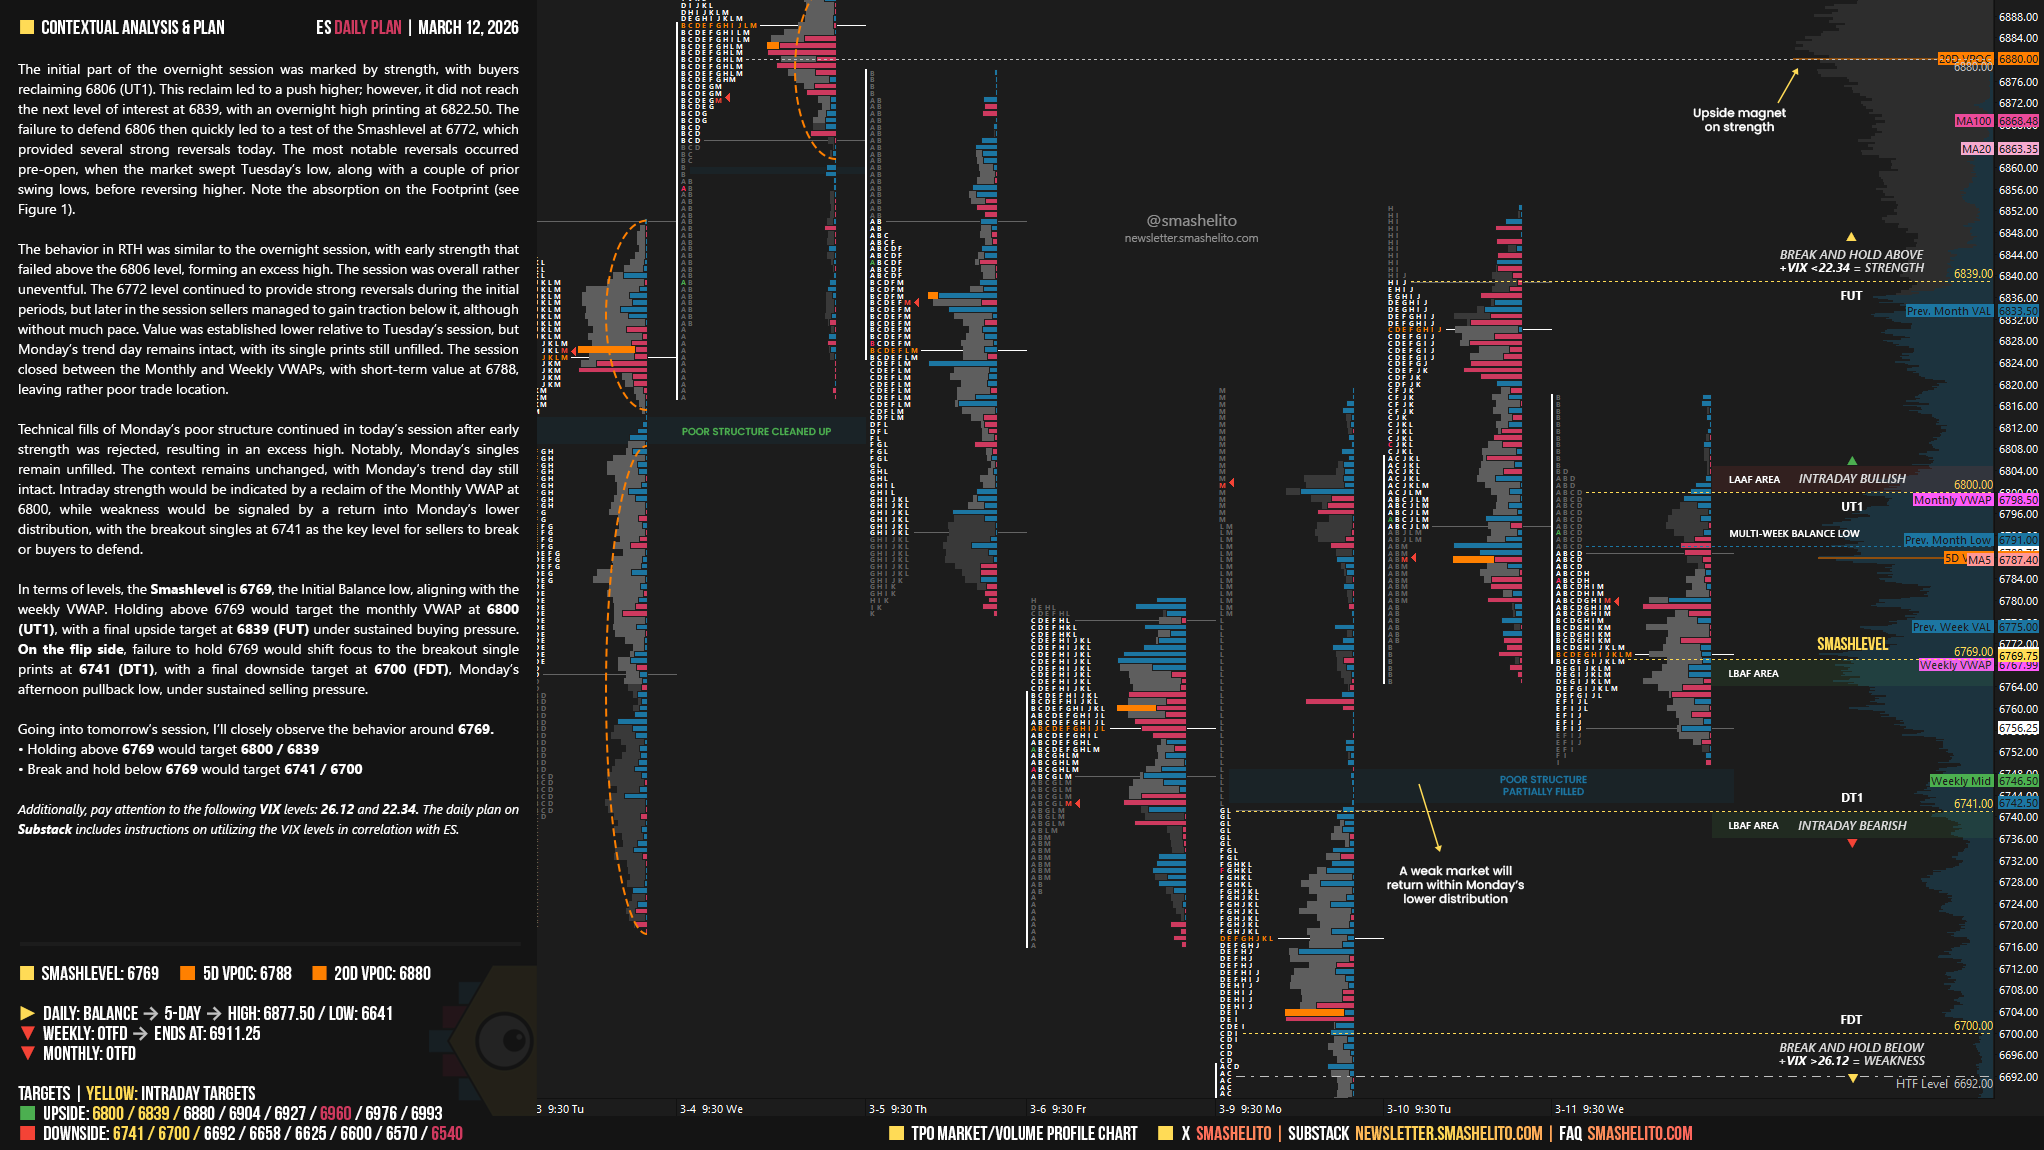
The behavior in RTH was similar to the overnight session, with early strength that failed above the 6806 level, forming an excess high. The session was overall rather uneventful. The 6772 level continued to provide strong reversals during the initial periods, but later in the session sellers managed to gain traction below it, although without much pace. Value was established lower relative to Tuesday’s session, but Monday’s trend day remains intact, with its single prints still unfilled. The session closed between the Monthly and Weekly VWAPs, with short-term value at 6788, leaving rather poor trade location.
Technical fills of Monday’s poor structure continued in today’s session after early strength was rejected, resulting in an excess high. Notably, Monday’s singles remain unfilled. The context remains unchanged, with Monday’s trend day still intact.
Intraday strength would be indicated by a reclaim of the Monthly VWAP at 6800, while weakness would be signaled by a return into Monday’s lower distribution, with the breakout singles at 6741 as the key level for sellers to break or buyers to defend.
In terms of levels, the Smashlevel is 6769, the Initial Balance low, aligning with the weekly VWAP. Holding above 6769 would target the monthly VWAP at 6800 (UT1), with a final upside target at 6839 (FUT) under sustained buying pressure.
On the flip side, failure to hold 6769 would shift focus to the breakout single prints at 6741 (DT1), with a final downside target at 6700 (FDT), Monday’s afternoon pullback low, under sustained selling pressure.
Levels of Interest
Going into tomorrow’s session, I’ll closely observe the behavior around 6769.
Holding above 6769 would target 6800 / 6839
Break and hold below 6769 would target 6741 / 6700
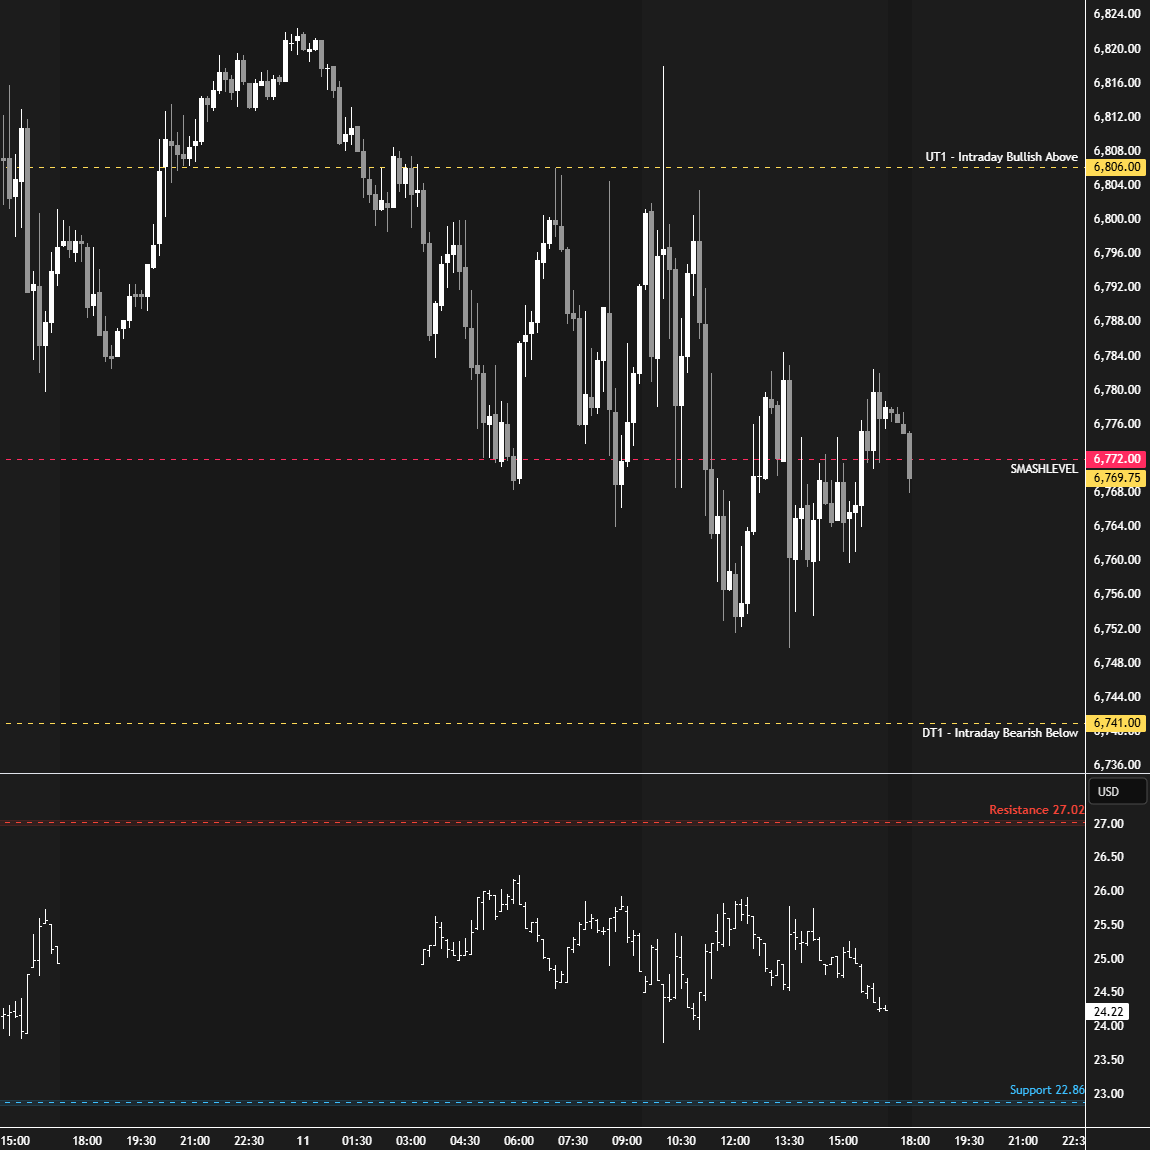
Additionally, pay attention to the following VIX levels: 26.12 and 22.34. These levels can provide confirmation of strength or weakness.
Break and hold above 6839 with VIX below 22.34 would confirm strength.
Break and hold below 6700 with VIX above 26.12 would confirm weakness.
Overall, it's important to exercise caution when trading outside of the highlighted yellow levels. A non-cooperative VIX may suggest possible reversals i.e trade setups.
Smash, you’re a legend. I try to predict the smash level after each session and I’m getting better at it which is helping me understand the auction better. Is there any one thing you look for in determining the level bc sometimes it’s an initial balance level or a late period low or high I’m trying to get better at understanding which levels are most important. Thanks for all you do!!
Thanks! Will be interesting to see if 6741 will be defended.