ES Daily Plan | July 9, 2024
Establishing value at these higher prices is bullish in the context of the recent directional move, indicating acceptance and the absence of stronger sellers thus far.
For new followers: the yellow levels highlighted at the bottom are the primary levels that I focus on intraday. My strategy for preventing impulsive decisions at unfavorable locations involves following a simple yet effective rule of exercising caution when initiating trades outside of the yellow levels. This implies that I am cautious chasing longs above the final yellow upside target and shorts below the final yellow downside target. It is crucial to understand that refraining from chasing a trade is not an automatic invitation to initiate a trade in the opposite direction.
Visual Representation
Contextual Analysis
In the weekly plan, we discussed that a market not showing interest in technical fills towards the breakout point at 5585 and instead establishing value at higher prices signals a bullish outcome. The overnight session initially held below Friday’s spike base of 5621; however, limited downside traction eventually led to new all-time highs.
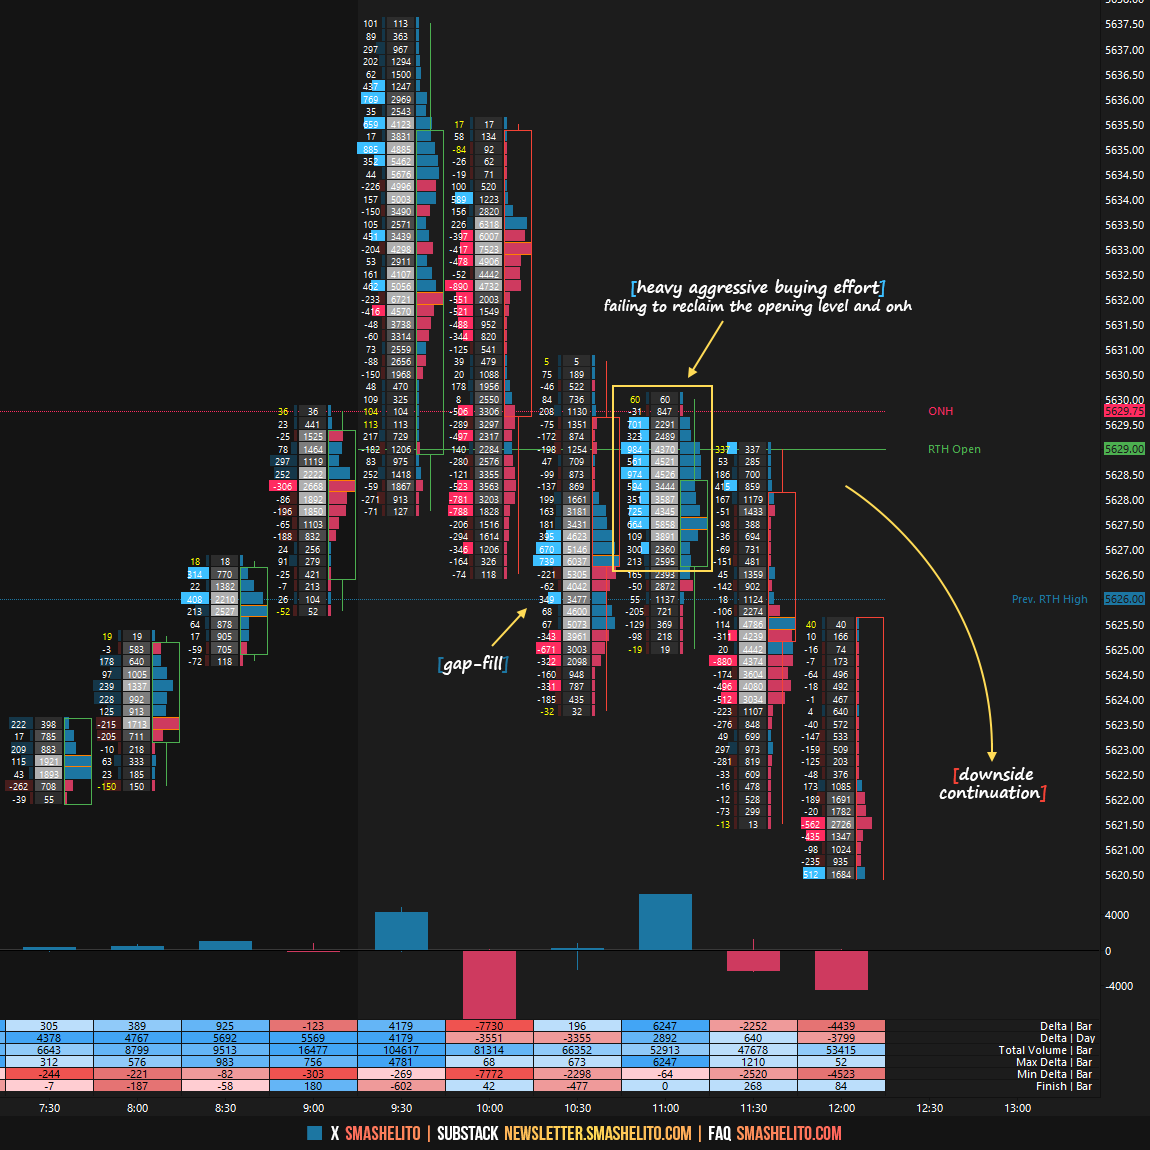
The RTH session opened with a true gap to the upside, which occurs when the RTH session opens completely outside of the previous day’s range. Buyers immediately took control of the opening level of 5629 and the overnight high—two key references when gapping higher, typically signaling the strongest response. However, the upside momentum stalled just 3 handles shy of the initial target of 5640 during the A-period. The B-period then saw heavy aggressive selling, quickly flipping the day delta from +4K to -5K at one point. Consequently, the market dropped below the opening level, and the gap was filled during this sequence. Of particular note was the subsequent bounce after the gap fill, where aggressive buyers were heavily absorbed by passive sellers against the opening level and overnight high. I will provide a separate visual of this on Substack. This absorption led to another downside leg; however, the main story today was the overall weakness displayed by sellers, especially noteworthy as the market has rallied over the past three sessions without a meaningful pullback.
After three consecutive sessions without a meaningful pullback, today saw consolidation following another ATH. Establishing value at these higher prices is bullish in the context of the recent directional move, indicating acceptance and the absence of stronger sellers thus far. Keep an eye on the buyers' ability to shift the short-term value (5D VPOC) higher, currently at 5531.
In terms of levels of interest, they remain unchanged. Holding above 5621 signals strength, with targets at 5640 and 5660, while a move below opens the door for filling Friday’s structure towards its halfback at 5605 and the breakout point at 5585—both levels where I'll be monitoring for buying activity.
For tomorrow, the Smashlevel (Pivot) is 5621, which represents Friday’s M-period spike base. Holding above 5621, signaling strength, would target an upside continuation toward 5640, with a final target at 5660 in case of continued strength. Break and hold below 5621 would target technical fills of Friday’s structure toward its halfback at 5605. Acceptance below 5605 would then target the final downside level of 5585, marking the breakout point—a crucial area for buyers to defend.
Levels of Interest
Going into tomorrow's session, I will closely observe the behavior around 5621.
Holding above 5621 would target 5640 / 5660
Break and hold below 5621 would target 5605 / 5585
Additionally, pay attention to the following VIX levels: 12.88 and 11.84. These levels can provide confirmation of strength or weakness.
Break and hold above 5660 with VIX below 11.84 would confirm strength.
Break and hold below 5585 with VIX above 12.88 would confirm weakness.
Overall, it's important to exercise caution when trading outside of the highlighted yellow levels. A non-cooperative VIX may suggest possible reversals i.e trade setups.
Weekly Plan
Be sure to check out the Weekly Plan, which provides a broader perspective and highlights significant levels of interest to watch in the coming week.
Disclaimer: Futures and options trading involves a high level of risk, with the potential for substantial losses. The information provided in this newsletter is for informational purposes only and is not intended to be a trade recommendation. It is the responsibility of the reader to make their own investment decisions and they should seek the advice of a qualified securities professional before making any investments. The owners/authors of this newsletter are not certified as registered financial professionals or investment advisers.


thank you:)
Thanks! Footprint example super helpful for learning