ES Daily Plan | July 24, 2024
My preparations and expectations for the upcoming session.
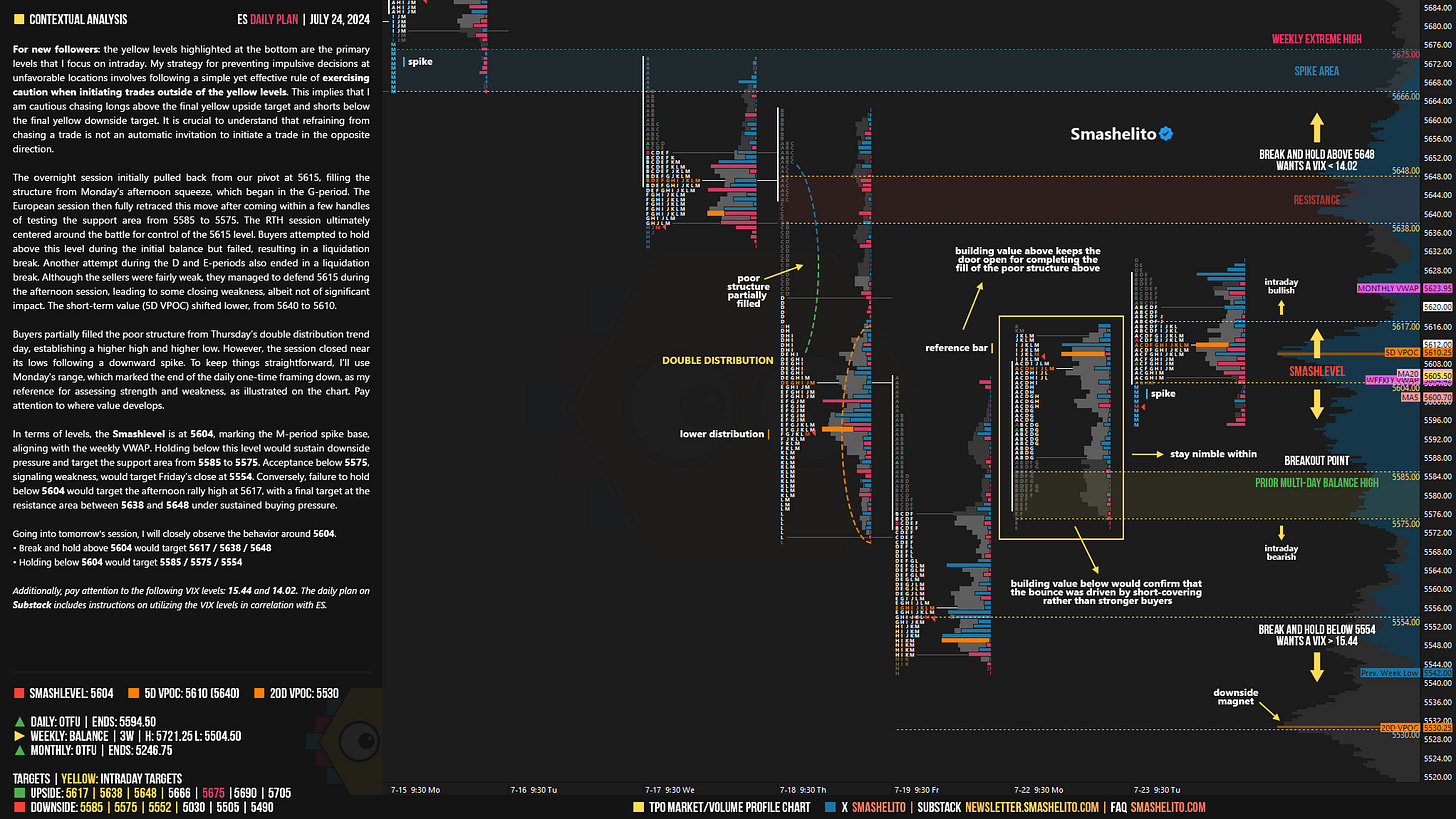
For new followers: the yellow levels highlighted at the bottom are the primary levels that I focus on intraday. My strategy for preventing impulsive decisions at unfavorable locations involves following a simple yet effective rule of exercising caution when initiating trades outside of the yellow levels. This implies that I am cautious chasing longs above the final yellow upside target and shorts below the final yellow downside target. It is crucial to understand that refraining from chasing a trade is not an automatic invitation to initiate a trade in the opposite direction.
Visual Representation
Contextual Analysis
The overnight session initially pulled back from our pivot at 5615, filling the structure from Monday’s afternoon squeeze, which began in the G-period. The European session then fully retraced this move after coming within a few handles of testing the support area from 5585 to 5575. The RTH session ultimately centered around the battle for control of the 5615 level. Buyers attempted to hold above this level during the initial balance but failed, resulting in a liquidation break. Another attempt during the D and E-periods also ended in a liquidation break. Although the sellers were fairly weak, they managed to defend 5615 during the afternoon session, leading to some closing weakness, albeit not of significant impact. The short-term value (5D VPOC) shifted lower, from 5640 to 5610.
Buyers partially filled the poor structure from Thursday’s double distribution trend day, establishing a higher high and higher low. However, the session closed near its lows following a downward spike. To keep things straightforward, I’ll use Monday's range, which marked the end of the daily one-time framing down, as my reference for assessing strength and weakness, as illustrated on the chart. Pay attention to where value develops.
In terms of levels, the Smashlevel is at 5604, marking the M-period spike base, aligning with the weekly VWAP. Holding below this level would sustain downside pressure and target the support area from 5585 to 5575. Acceptance below 5575, signaling weakness, would target Friday’s close at 5554. Conversely, failure to hold below 5604 would target the afternoon rally high at 5617, with a final target at the resistance area between 5638 and 5648 under sustained buying pressure.
Levels of Interest
Going into tomorrow's session, I will closely observe the behavior around 5604.
Break and hold above 5604 would target 5617 / 5638 / 5648
Holding below 5604 would target 5585 / 5575 / 5554
Additionally, pay attention to the following VIX levels: 15.44 and 14.02. These levels can provide confirmation of strength or weakness.
Break and hold above 5648 with VIX below 14.02 would confirm strength.
Break and hold below 5554 with VIX above 15.44 would confirm weakness.
Overall, it's important to exercise caution when trading outside of the highlighted yellow levels. A non-cooperative VIX may suggest possible reversals i.e trade setups.
Weekly Plan
Be sure to check out the Weekly Plan, which provides a broader perspective and highlights significant levels of interest to watch in the coming week.
Disclaimer: Futures and options trading involves a high level of risk, with the potential for substantial losses. The information provided in this newsletter is for informational purposes only and is not intended to be a trade recommendation. It is the responsibility of the reader to make their own investment decisions and they should seek the advice of a qualified securities professional before making any investments. The owners/authors of this newsletter are not certified as registered financial professionals or investment advisers.


Great content smash - been helping a lot for me. Question for you though, what is the difference in volume profiles you have? One in blue vs one behind it in gray? Thanks
Thanks Smash!