ES Daily Plan | January 25, 2024
I will closely monitor the behavior around the 4899 level to gauge whether more weakness is in play, potentially targeting 4881 and 4860, or if buyers will use this dip as fuel for a revisit of 4930.
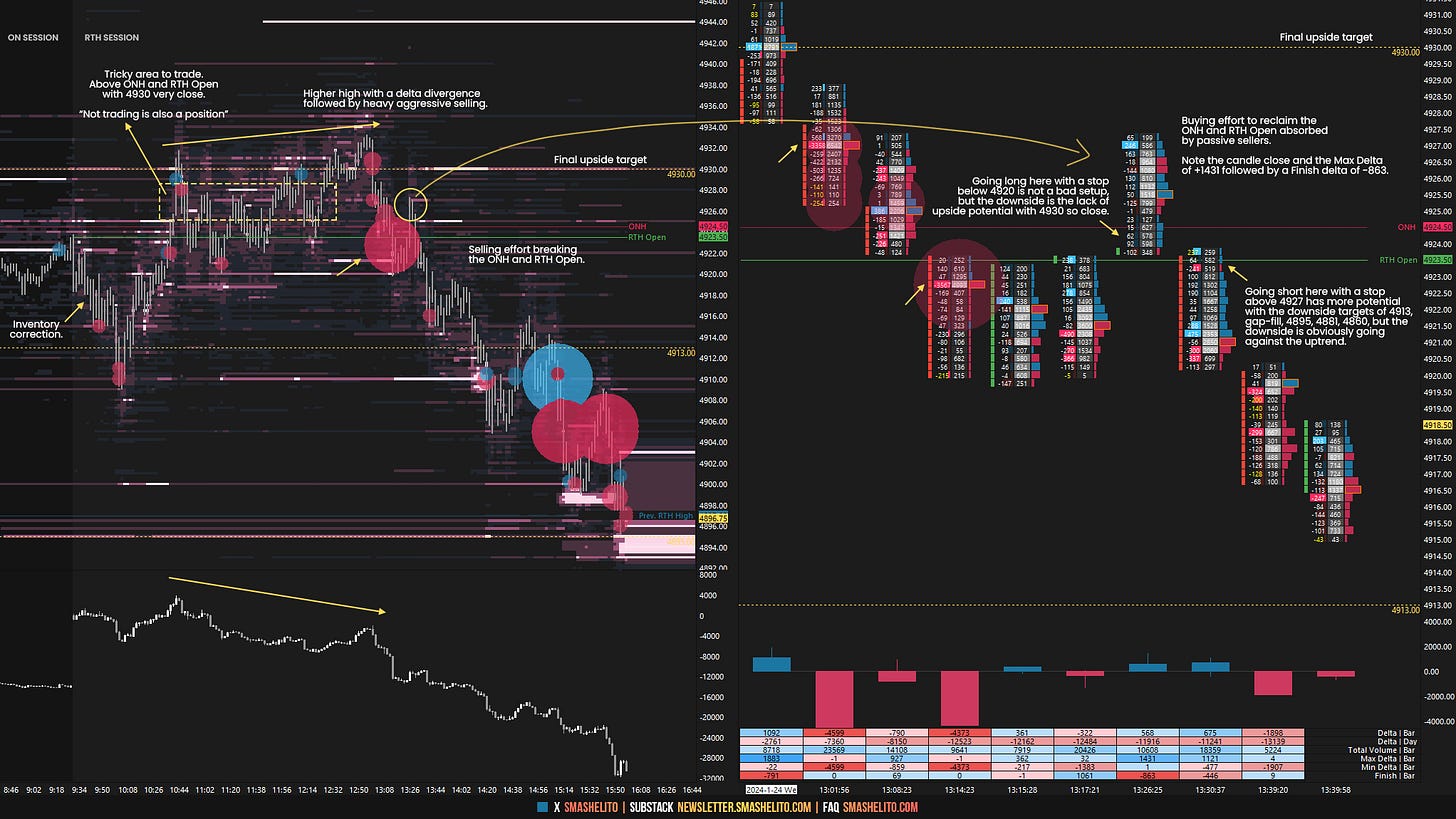
Visual Representation
For new followers, the yellow levels highlighted at the bottom are the primary levels that I focus on intraday. My strategy for preventing impulsive decisions at unfavorable locations involves following a simple yet effective rule of exercising caution when initiating trades outside of the yellow levels. This implies that I am cautious chasing longs above the final yellow upside target and shorts below the final yellow downside target. It is crucial to understand that refraining from chasing a trade is not an automatic invitation to initiate a trade in the opposite direction.
Contextual Analysis
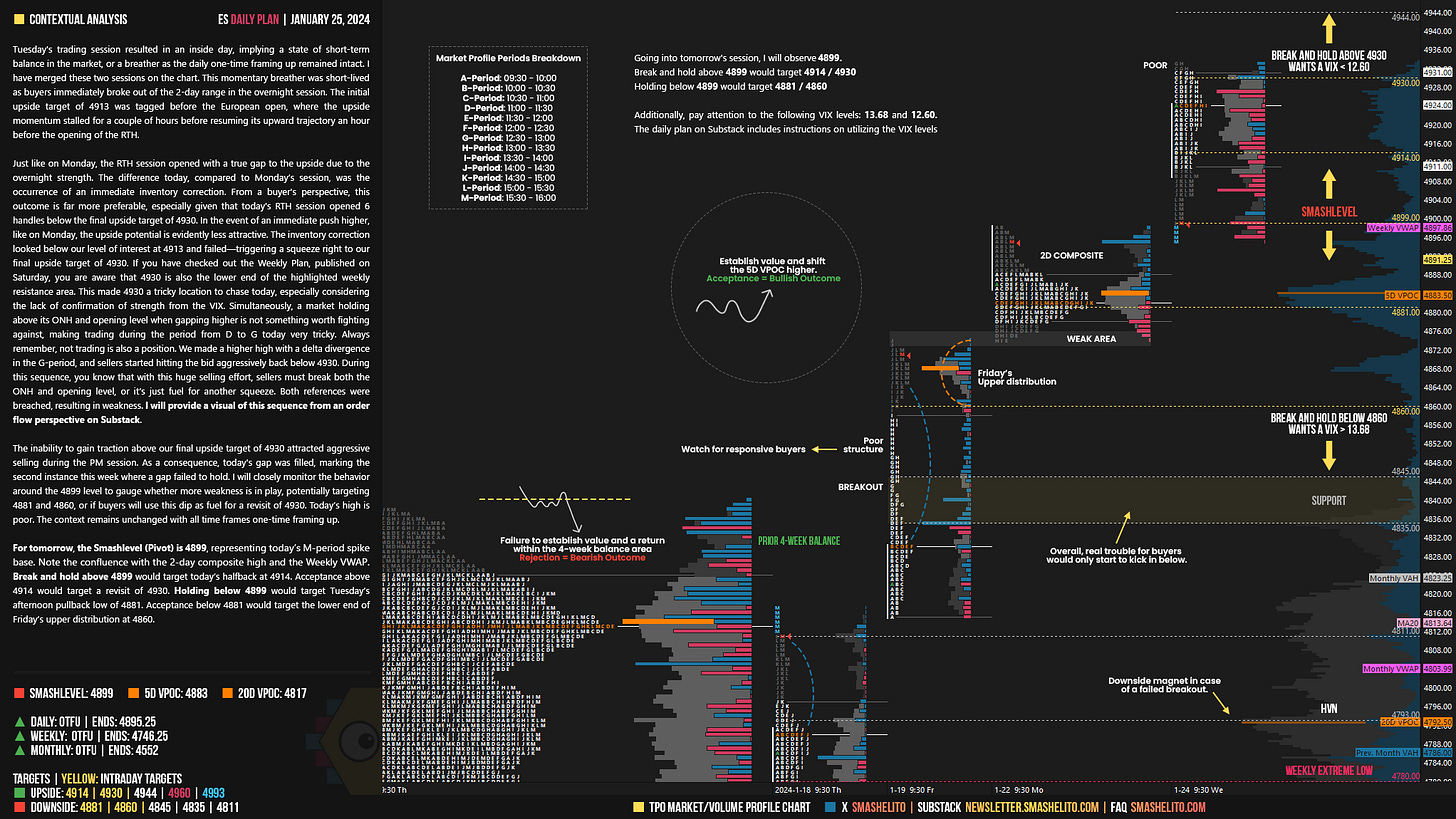
Tuesday's trading session resulted in an inside day, implying a state of short-term balance in the market, or a breather as the daily one-time framing up remained intact. I have merged these two sessions on the chart. This momentary breather was short-lived as buyers immediately broke out of the 2-day range in the overnight session. The initial upside target of 4913 was tagged before the European open, where the upside momentum stalled for a couple of hours before resuming its upward trajectory an hour before the opening of the RTH.
Just like on Monday, the RTH session opened with a true gap to the upside due to the overnight strength. The difference today, compared to Monday’s session, was the occurrence of an immediate inventory correction. From a buyer's perspective, this outcome is far more preferable, especially given that today's RTH session opened 6 handles below the final upside target of 4930. In the event of an immediate push higher, like on Monday, the upside potential is evidently less attractive. The inventory correction looked below our level of interest at 4913 and failed—triggering a squeeze right to our final upside target of 4930. If you have checked out the Weekly Plan, published on Saturday, you are aware that 4930 is also the lower end of the highlighted weekly resistance area. This made 4930 a tricky location to chase today, especially considering the lack of confirmation of strength from the VIX. Simultaneously, a market holding above its ONH and opening level when gapping higher is not something worth fighting against, making trading during the period from D to G today very tricky. Always remember, not trading is also a position. We made a higher high with a delta divergence in the G-period, and sellers started hitting the bid aggressively back below 4930. During this sequence, you know that with this huge selling effort, sellers must break both the ONH and opening level, or it’s just fuel for another squeeze. Both references were breached, resulting in weakness.
The inability to gain traction above our final upside target of 4930 attracted aggressive selling during the PM session. As a consequence, today's gap was filled, marking the second instance this week where a gap failed to hold. I will closely monitor the behavior around the 4899 level to gauge whether more weakness is in play, potentially targeting 4881 and 4860, or if buyers will use this dip as fuel for a revisit of 4930. Today’s high is poor. The context remains unchanged with all time frames one-time framing up.
For tomorrow, the Smashlevel (Pivot) is 4899, representing today’s M-period spike base. Note the confluence with the 2-day composite high and the Weekly VWAP. Break and hold above 4899 would target today’s halfback at 4914. Acceptance above 4914 would target a revisit of 4930. Holding below 4899 would target Tuesday’s afternoon pullback low of 4881. Acceptance below 4881 would target the lower end of Friday’s upper distribution at 4860.
Levels of Interest
Going into tomorrow's session, I will observe 4899.
Break and hold above 4899 would target 4914 / 4930
Holding below 4899 would target 4881 / 4860
Additionally, pay attention to the following VIX levels: 13.68 and 12.60. These levels can provide confirmation of strength or weakness.
Break and hold above 4930 with VIX below 12.60 would confirm strength.
Break and hold below 4860 with VIX above 13.68 would confirm weakness.
Overall, it's important to exercise caution when trading outside of the highlighted yellow levels. A non-cooperative VIX may suggest possible reversals i.e trade setups.
Weekly Plan
Be sure to check out the Weekly Plan, which provides a broader perspective and highlights significant levels of interest to watch in the coming week.
Disclaimer: Futures and options trading involves a high level of risk, with the potential for substantial losses. The information provided in this newsletter is for informational purposes only and is not intended to be a trade recommendation. It is the responsibility of the reader to make their own investment decisions and they should seek the advice of a qualified securities professional before making any investments. The owners/authors of this newsletter are not certified as registered financial professionals or investment advisers.


Thank you! Love the breakdown!
Thanks, buddy! Today was another excellent day for trading. I maintained a long position for most of the day until the 1 PM auction triggered a downward trend.