ES Daily Plan | January 19, 2024
The closing session established a spike, with a base at 4811, which is of interest in the short-term. Monitor for acceptance or rejection of the higher prices of the highlighted spike.
Visual Representation
For new followers, the yellow levels highlighted at the bottom are the primary levels that I focus on intraday. My strategy for preventing impulsive decisions at unfavorable locations involves following a simple yet effective rule of exercising caution when initiating trades outside of the yellow levels. This implies that I am cautious chasing longs above the final yellow upside target and shorts below the final yellow downside target. It is crucial to understand that refraining from chasing a trade is not an automatic invitation to initiate a trade in the opposite direction.
Contextual Analysis
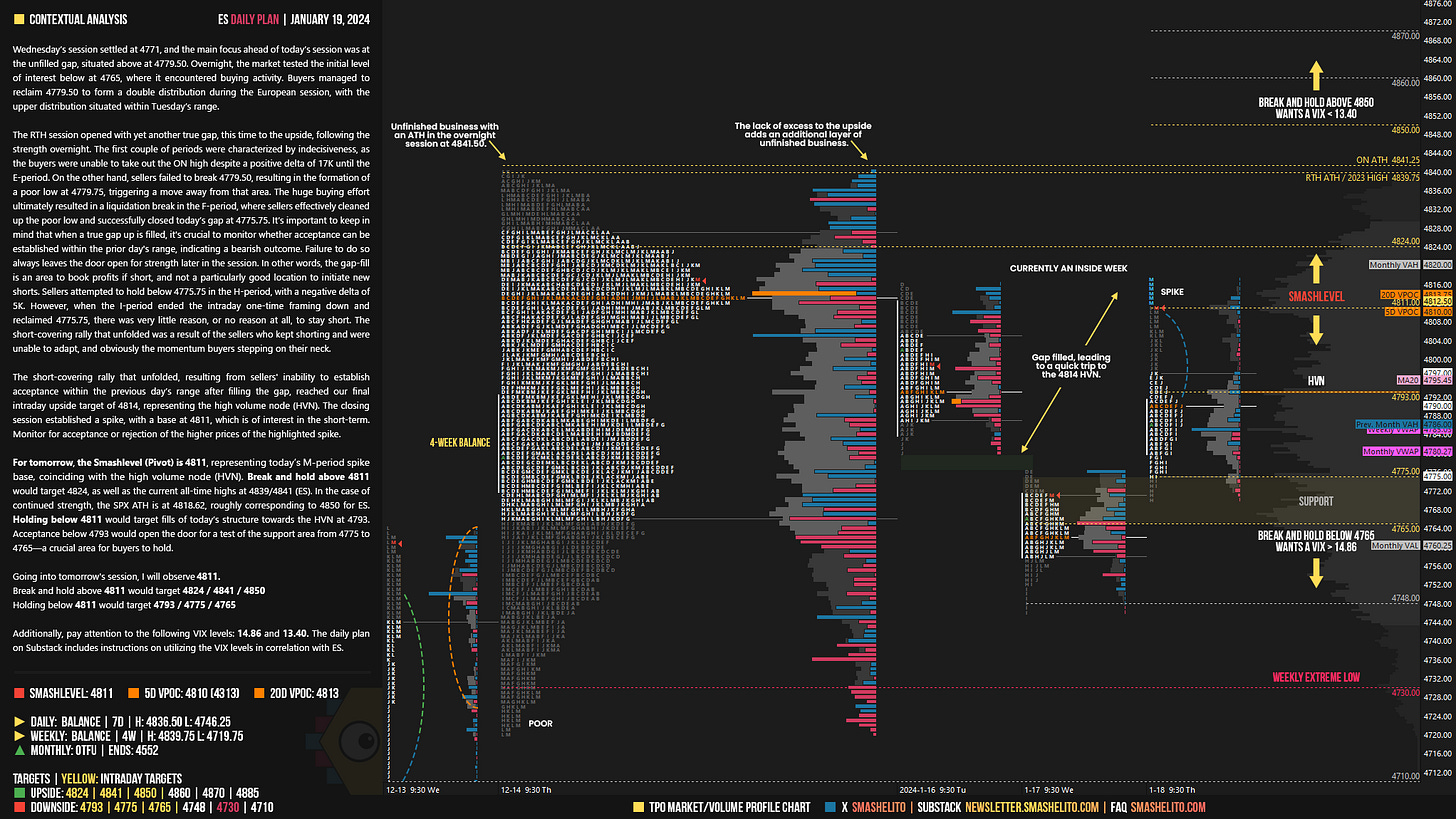
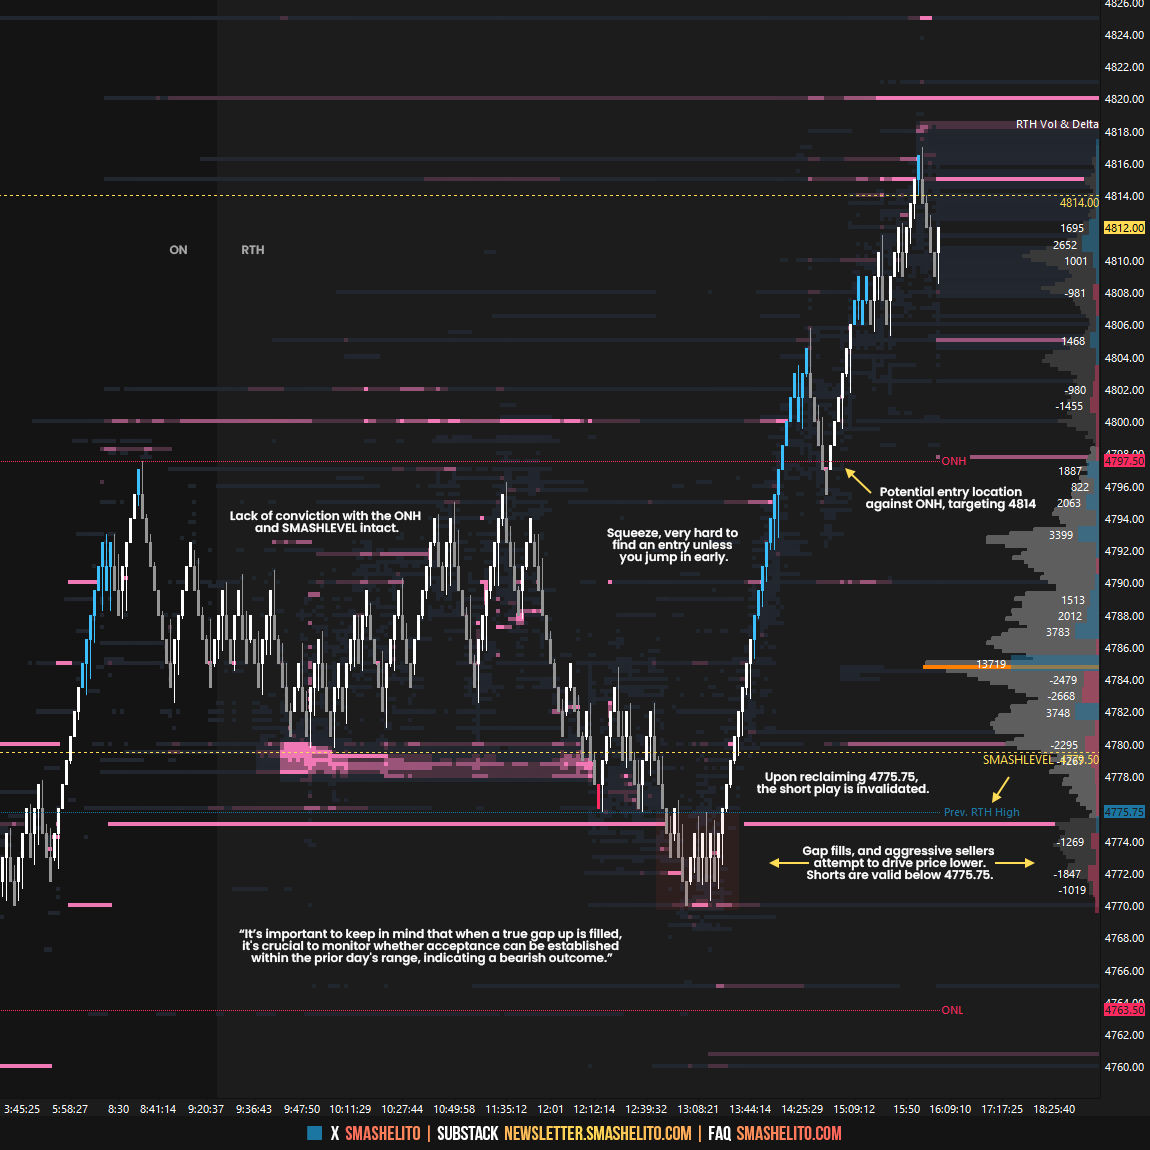
Wednesday’s session settled at 4771, and the main focus ahead of today’s session was at the unfilled gap, situated above at 4779.50. Overnight, the market tested the initial level of interest below at 4765, where it encountered buying activity. Buyers managed to reclaim 4779.50 to form a double distribution during the European session, with the upper distribution situated within Tuesday’s range.
The RTH session opened with yet another true gap, this time to the upside, following the strength overnight. The first couple of periods were characterized by indecisiveness, as the buyers were unable to take out the ON high despite a positive delta of 17K until the E-period. On the other hand, sellers failed to break 4779.50, resulting in the formation of a poor low at 4779.75, triggering a move away from that area. The huge buying effort ultimately resulted in a liquidation break in the F-period, where sellers effectively cleaned up the poor low and successfully closed today’s gap at 4775.75. It’s important to keep in mind that when a true gap down is filled, it's crucial to monitor whether acceptance can be established within the prior day's range, indicating a bearish outcome. Failure to do so always leaves the door open for strength later in the session. In other words, the gap-fill is an area to book profits if short, and not a particularly good location to initiate new shorts. Sellers attempted to hold below 4775.75 in the H-period, with a negative delta of 5K. However, when the I-period ended the intraday one-time framing down and reclaimed 4775.75, there was very little reason, or no reason at all, to stay short. The short-covering rally that unfolded was a result of the sellers who kept shorting and were unable to adapt, and obviously the momentum buyers stepping on their neck.
The short-covering rally that unfolded, resulting from sellers' inability to establish acceptance within the previous day’s range after filling the gap, reached our final intraday upside target of 4814, representing the high volume node (HVN). The closing session established a spike, with a base at 4811, which is of interest in the short-term. Monitor for acceptance or rejection of the higher prices of the highlighted spike.
For tomorrow, the Smashlevel (Pivot) is 4811, representing today’s M-period spike base, coinciding with the high volume node (HVN). Break and hold above 4811 would target 4824, as well as the current all-time highs at 4839/4841 (ES). In the case of continued strength, the SPX ATH is at 4818.62, roughly corresponding to 4850 for ES. Holding below 4811 would target fills of today’s structure towards the HVN at 4793. Acceptance below 4793 would open the door for a test of the support area from 4775 to 4765—a crucial area for buyers to hold.
Levels of Interest
Going into tomorrow's session, I will observe 4811.
Break and hold above 4811 would target 4824 / 4841 / 4850
Holding below 4811 would target 4793 / 4775 / 4765
Additionally, pay attention to the following VIX levels: 14.86 and 13.40. These levels can provide confirmation of strength or weakness.
Break and hold above 4850 with VIX below 13.40 would confirm strength.
Break and hold below 4765 with VIX above 14.86 would confirm weakness.
Overall, it's important to exercise caution when trading outside of the highlighted yellow levels. A non-cooperative VIX may suggest possible reversals i.e trade setups.
Weekly Plan
Be sure to check out the Weekly Plan, which provides a broader perspective and highlights significant levels of interest to watch in the coming week.
Disclaimer: Futures and options trading involves a high level of risk, with the potential for substantial losses. The information provided in this newsletter is for informational purposes only and is not intended to be a trade recommendation. It is the responsibility of the reader to make their own investment decisions and they should seek the advice of a qualified securities professional before making any investments. The owners/authors of this newsletter are not certified as registered financial professionals or investment advisers.


Thank you, buddy. Another amazing trading day took longs and shorts.