ES Daily Plan | February 14, 2024
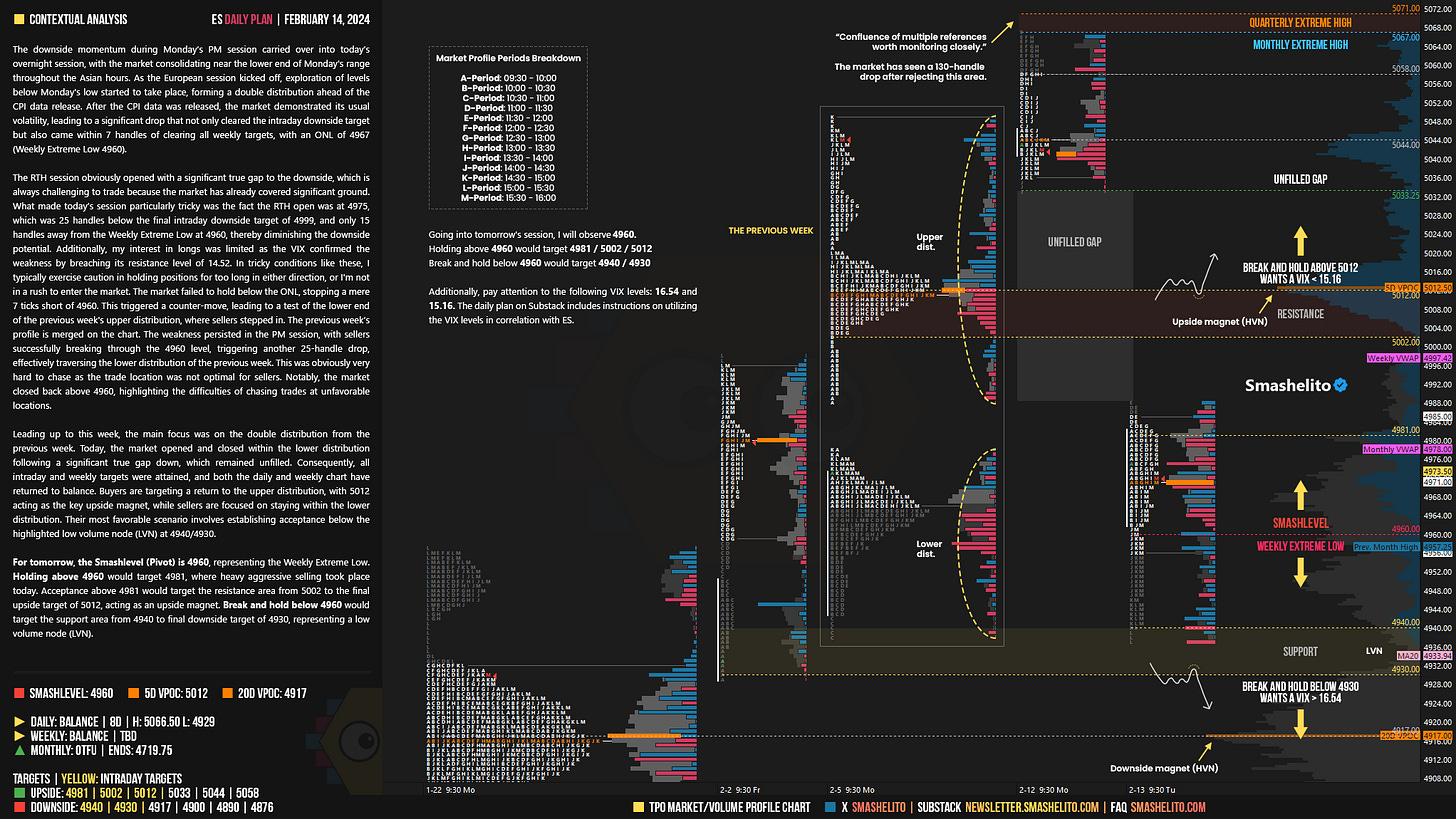
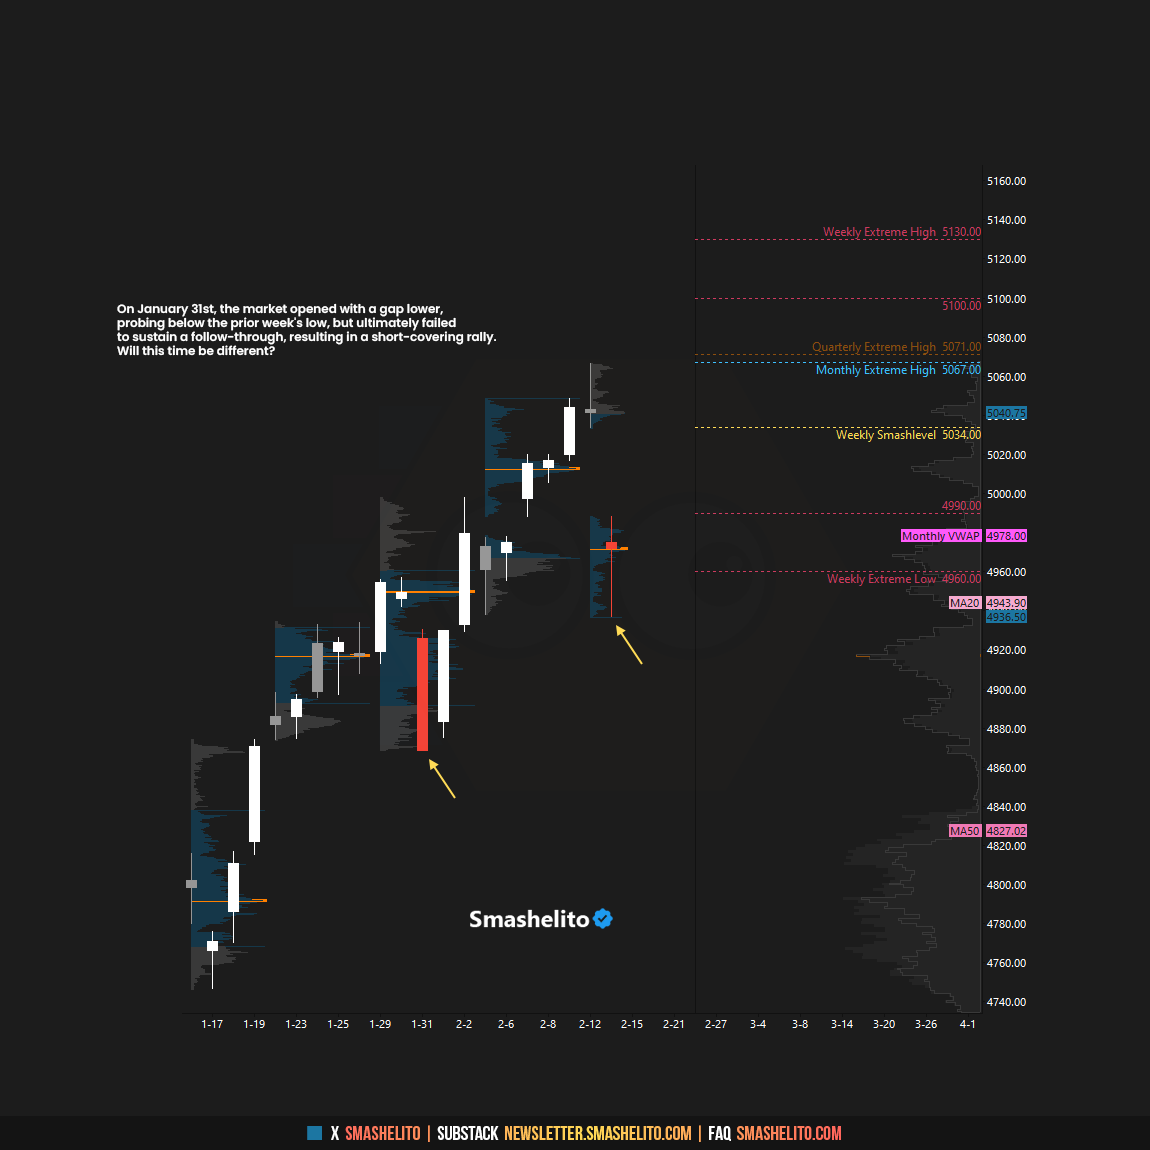
Buyers are targeting a return to the previous week's upper distribution, while sellers are focused on staying within the lower distribution.
Visual Representation
For new followers, the yellow levels highlighted at the bottom are the primary levels that I focus on intraday. My strategy for preventing impulsive decisions at unfavorable locations involves following a simple yet effective rule of exercising caution when initiating trades outside of the yellow levels. This implies that I am cautious chasing longs above the final yellow upside target and shorts below the final yellow downside target. It is crucial to understand that refraining from chasing a trade is not an automatic invitation to initiate a trade in the opposite direction.
Contextual Analysis
The downside momentum during Monday’s PM session carried over into today’s overnight session, with the market consolidating near the lower end of Monday's range throughout the Asian hours. As the European session kicked off, exploration of levels below Monday's low started to take place, forming a double distribution ahead of the CPI data release. After the CPI data was released, the market demonstrated its usual volatility, leading to a significant drop that not only cleared the intraday downside target but also came within 7 handles of clearing all weekly targets, with an ONL of 4967 (Weekly Extreme Low 4960).
The RTH session obviously opened with a significant true gap to the downside, which is always challenging to trade because the market has already covered significant ground. What made today’s session particularly tricky was the fact the RTH open was at 4975, which was 25 handles below the final intraday downside target of 4999, and only 15 handles away from the Weekly Extreme Low at 4960, thereby diminishing the downside potential. Additionally, my interest in longs was limited as the VIX confirmed the weakness by breaching its resistance level of 14.52. In tricky conditions like these, I typically exercise caution in holding positions for too long in either direction, or I'm not in a rush to enter the market. The market failed to hold below the ONL, stopping a mere 7 ticks short of 4960. This triggered a counter-move, leading to a test of the lower end of the previous week's upper distribution, where sellers stepped in. The previous week’s profile is merged on the chart. The weakness persisted in the PM session, with sellers successfully breaking through the 4960 level, triggering another 25-handle drop, effectively traversing the lower distribution of the previous week. This was obviously very hard to chase as the trade location was not optimal for sellers. Notably, the market closed back above 4960, highlighting the difficulties of chasing trades at unfavorable locations.
Leading up to this week, the main focus was on the double distribution from the previous week. Today, the market opened and closed within the lower distribution following a significant true gap down, which remained unfilled. Consequently, all intraday and weekly targets were attained, and both the daily and weekly chart have returned to balance. Buyers are targeting a return to the upper distribution, with 5012 acting as the key upside magnet, while sellers are focused on staying within the lower distribution. Their most favorable scenario involves establishing acceptance below the highlighted low volume node (LVN) at 4940/4930.
For tomorrow, the Smashlevel (Pivot) is 4960, representing the Weekly Extreme Low. Holding above 4960 would target 4981, where heavy aggressive selling took place today. Acceptance above 4981 would target the resistance area from 5002 to the final upside target of 5012, acting as an upside magnet. Break and hold below 4960 would target the support area from 4940 to final downside target of 4930, representing a low volume node (LVN).
Levels of Interest
Going into tomorrow's session, I will observe 4960.
Holding above 4960 would target 4981 / 5002 / 5012
Break and hold below 4960 would target 4940 / 4930
Additionally, pay attention to the following VIX levels: 16.54 and 15.16. These levels can provide confirmation of strength or weakness.
Break and hold above 5012 with VIX below 15.16 would confirm strength.
Break and hold below 4930 with VIX above 16.54 would confirm weakness.
Overall, it's important to exercise caution when trading outside of the highlighted yellow levels. A non-cooperative VIX may suggest possible reversals i.e trade setups.
Weekly Plan
Be sure to check out the Weekly Plan, which provides a broader perspective and highlights significant levels of interest to watch in the coming week.
Disclaimer: Futures and options trading involves a high level of risk, with the potential for substantial losses. The information provided in this newsletter is for informational purposes only and is not intended to be a trade recommendation. It is the responsibility of the reader to make their own investment decisions and they should seek the advice of a qualified securities professional before making any investments. The owners/authors of this newsletter are not certified as registered financial professionals or investment advisers.


Great work as always!
Thank you, buddy! Short scalps all the way, but I also got longs nearer to the close.