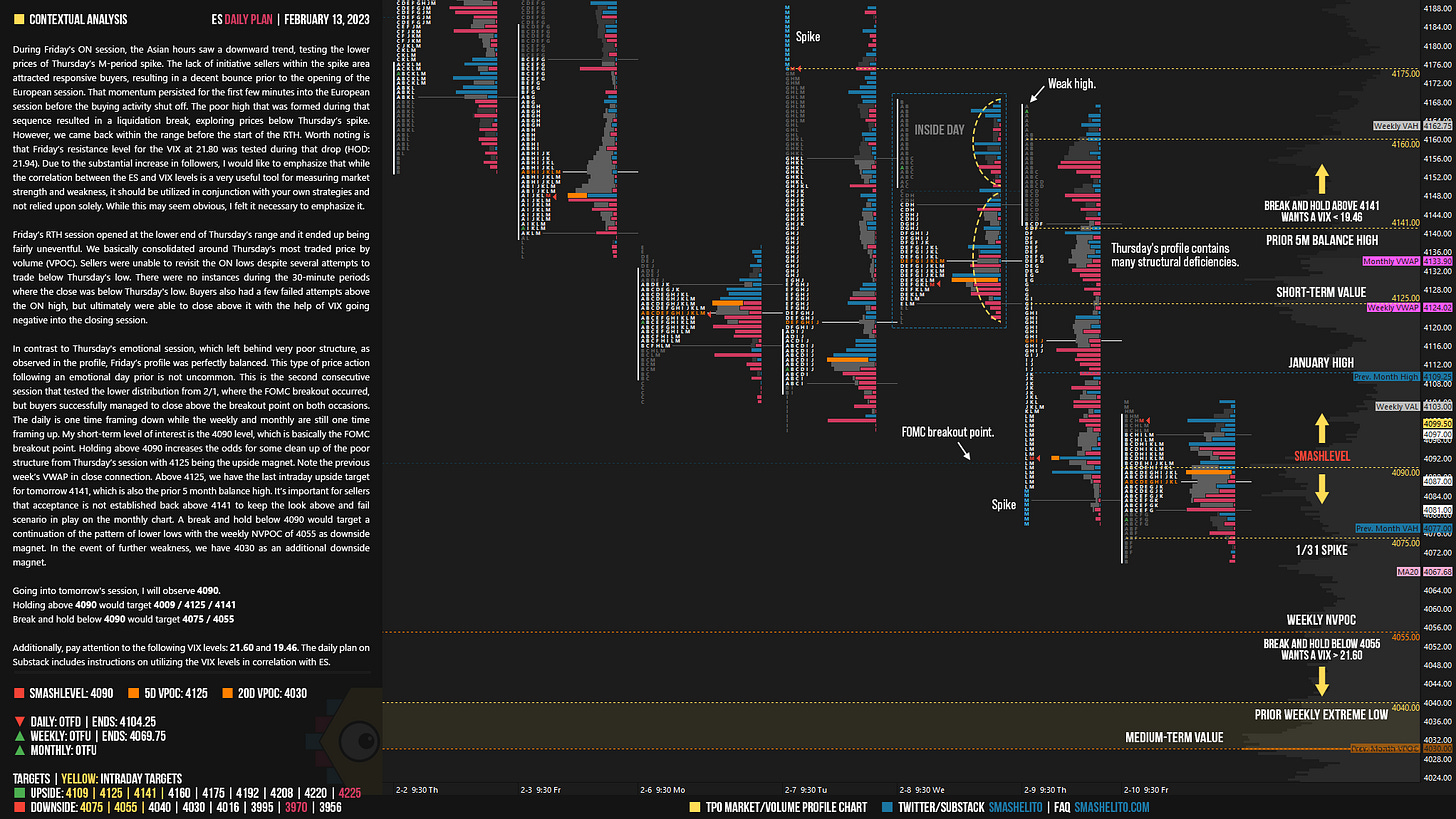
ES Daily Plan | February 13, 2023
In contrast to Thursday's emotional session, which left behind very poor structure, as observed in the profile, Friday’s profile was perfectly balanced.
Daily is one time framing down, which sellers want to maintain.
Contextual Analysis
During Friday's ON session, the Asian hours saw a downward trend, testing the lower prices of Thursday’s M-period spike. The lack of initiative sellers within the spike area attracted responsive buyers, resulting in a decent bounce prior to the opening of the European session. That momentum persisted for the first few minutes into the European session before the buying activity shut off. The poor high that was formed during that sequence resulted in a liquidation break, exploring prices below Thursday’s spike. However, we came back within the range before the start of the RTH. Worth noting is that Friday’s resistance level for the VIX at 21.80 was tested during that drop (HOD: 21.94). Due to the substantial increase in followers, I would like to emphasize that while the correlation between the ES and VIX levels is a very useful tool for measuring market strength and weakness, it should be utilized in conjunction with your own strategies and not relied upon solely. While this may seem obvious, I felt it necessary to emphasize it.
Friday’s RTH session opened at the lower end of Thursday’s range and it ended up being fairly uneventful. We basically consolidated around Thursday’s most traded price by volume (VPOC). Sellers were unable to revisit the ON lows despite several attempts to trade below Thursday's low. There were no instances during the 30-minute periods where the close was below Thursday's low. Buyers also had a few failed attempts above the ON high, but ultimately were able to close above it with the help of VIX going negative into the closing session.
In contrast to Thursday's emotional session, which left behind very poor structure, as observed in the profile, Friday’s profile was perfectly balanced. This type of price action following an emotional day prior is not uncommon. This is the second consecutive session that tested the lower distribution from 2/1, where the FOMC breakout occurred, but buyers successfully managed to close above the breakout point on both occasions. The daily is one time framing down while the weekly and monthly are still one time framing up. My short-term level of interest is the 4090 level, which is basically the FOMC breakout point. Holding above 4090 increases the odds for some clean up of the poor structure from Thursday’s session with 4125 being the upside magnet. Note the previous week’s VWAP in close connection. Above 4125, we have the last intraday upside target for tomorrow 4141, which is also the prior 5 month balance high. It’s important for sellers that acceptance is not established back above 4141 to keep the look above and fail scenario in play on the monthly chart. A break and hold below 4090 would target a continuation of the pattern of lower lows with the weekly NVPOC of 4055 as downside magnet. In the event of further weakness, we have 4030 as an additional downside magnet.
Going into tomorrow's session, I will observe 4090.
Holding above 4090 would target 4009 / 4125 / 4141
Break and hold below 4090 would target 4075 / 4055
Additionally, pay attention to the following VIX levels: 21.60 and 19.46. These levels can provide confirmation of strength or weakness.
Break and hold above 4141 with VIX below 19.46 would confirm strength.
Break and hold below 4055 with VIX above 21.60 would confirm weakness.
Overall, it's important to exercise caution when trading outside of the highlighted yellow levels. A non-cooperative VIX may suggest possible reversals i.e trade setups.
Be sure to check out the Weekly Plan, which provides a broader perspective and highlights significant levels of interest to watch in the coming week.
Disclaimer: Futures and options trading involves a high level of risk, with the potential for substantial losses. The information provided in this newsletter is for informational purposes only and is not intended to be a trade recommendation. It is the responsibility of the reader to make their own investment decisions and they should seek the advice of a qualified securities professional before making any investments. The owners/authors of this newsletter are not certified as registered financial professionals or investment advisers.
Twitter: @smashelito | FAQ: smashelito.com


Smash, question
what do you consider acceptance?
a 30min candle close? an hr candle close? a couple of those candle closes?
I am having trouble determining my entries for day trading these daily levels.
But I am thinking perhaps swing may be better for me so I am looking at the weekly levels more lately.
Acceptance is something I struggle with determining.
Any insight with this would be very helpful.
Again, thank you for EVERYTHING and ALL the valuable info you give us daily.
And I hope you have fully recovered and are feeling AWESOME!
Thanks Smash -Which platform would you recommend for spx futures?