
ES Daily Plan | December 30, 2025
Market Context & Key Levels for the Day Ahead

— For new subscribers
The yellow levels highlighted at the bottom left of the chart are the primary intraday levels I focus on. To avoid impulsive decisions at poor trade locations, I follow a simple but effective rule: exercise caution when initiating trades outside of these yellow levels.
This means I’m cautious about chasing longs above the Final Upside Target (FUT) and shorts below the Final Downside Target (FDT). It’s important to understand that not chasing does not imply initiating a trade in the opposite direction — discipline over impulse.
Be sure to review the Weekly Plan for a broader perspective, key levels, and market expectations for the week ahead.

Contextual Analysis & Plan
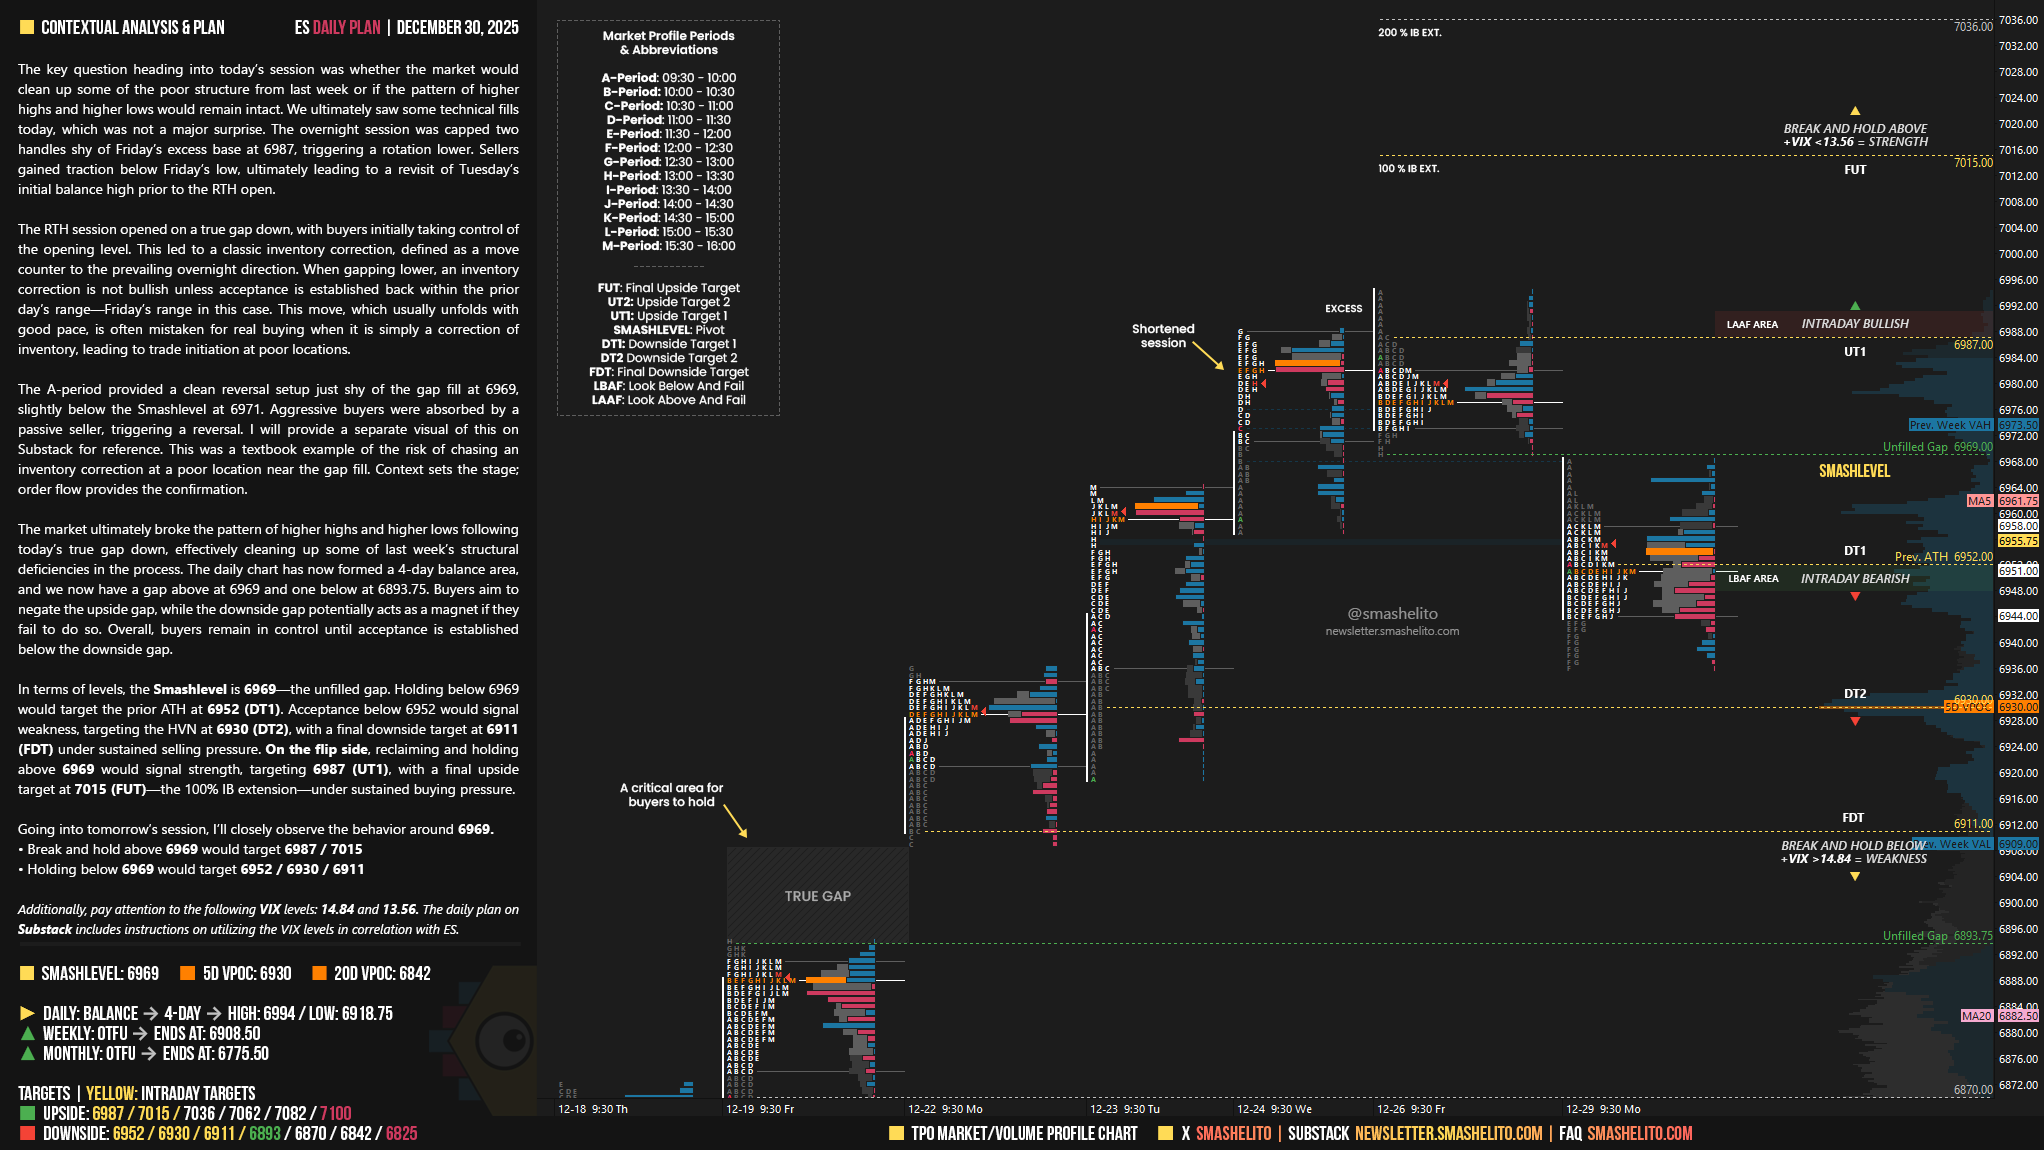
The key question heading into today’s session was whether the market would clean up some of the poor structure from last week or if the pattern of higher highs and higher lows would remain intact. We ultimately saw some technical fills today, which was not a major surprise. The overnight session was capped two handles shy of Friday’s excess base at 6987, triggering a rotation lower. Sellers gained traction below Friday’s low, ultimately leading to a revisit of Tuesday’s initial balance high prior to the RTH open.
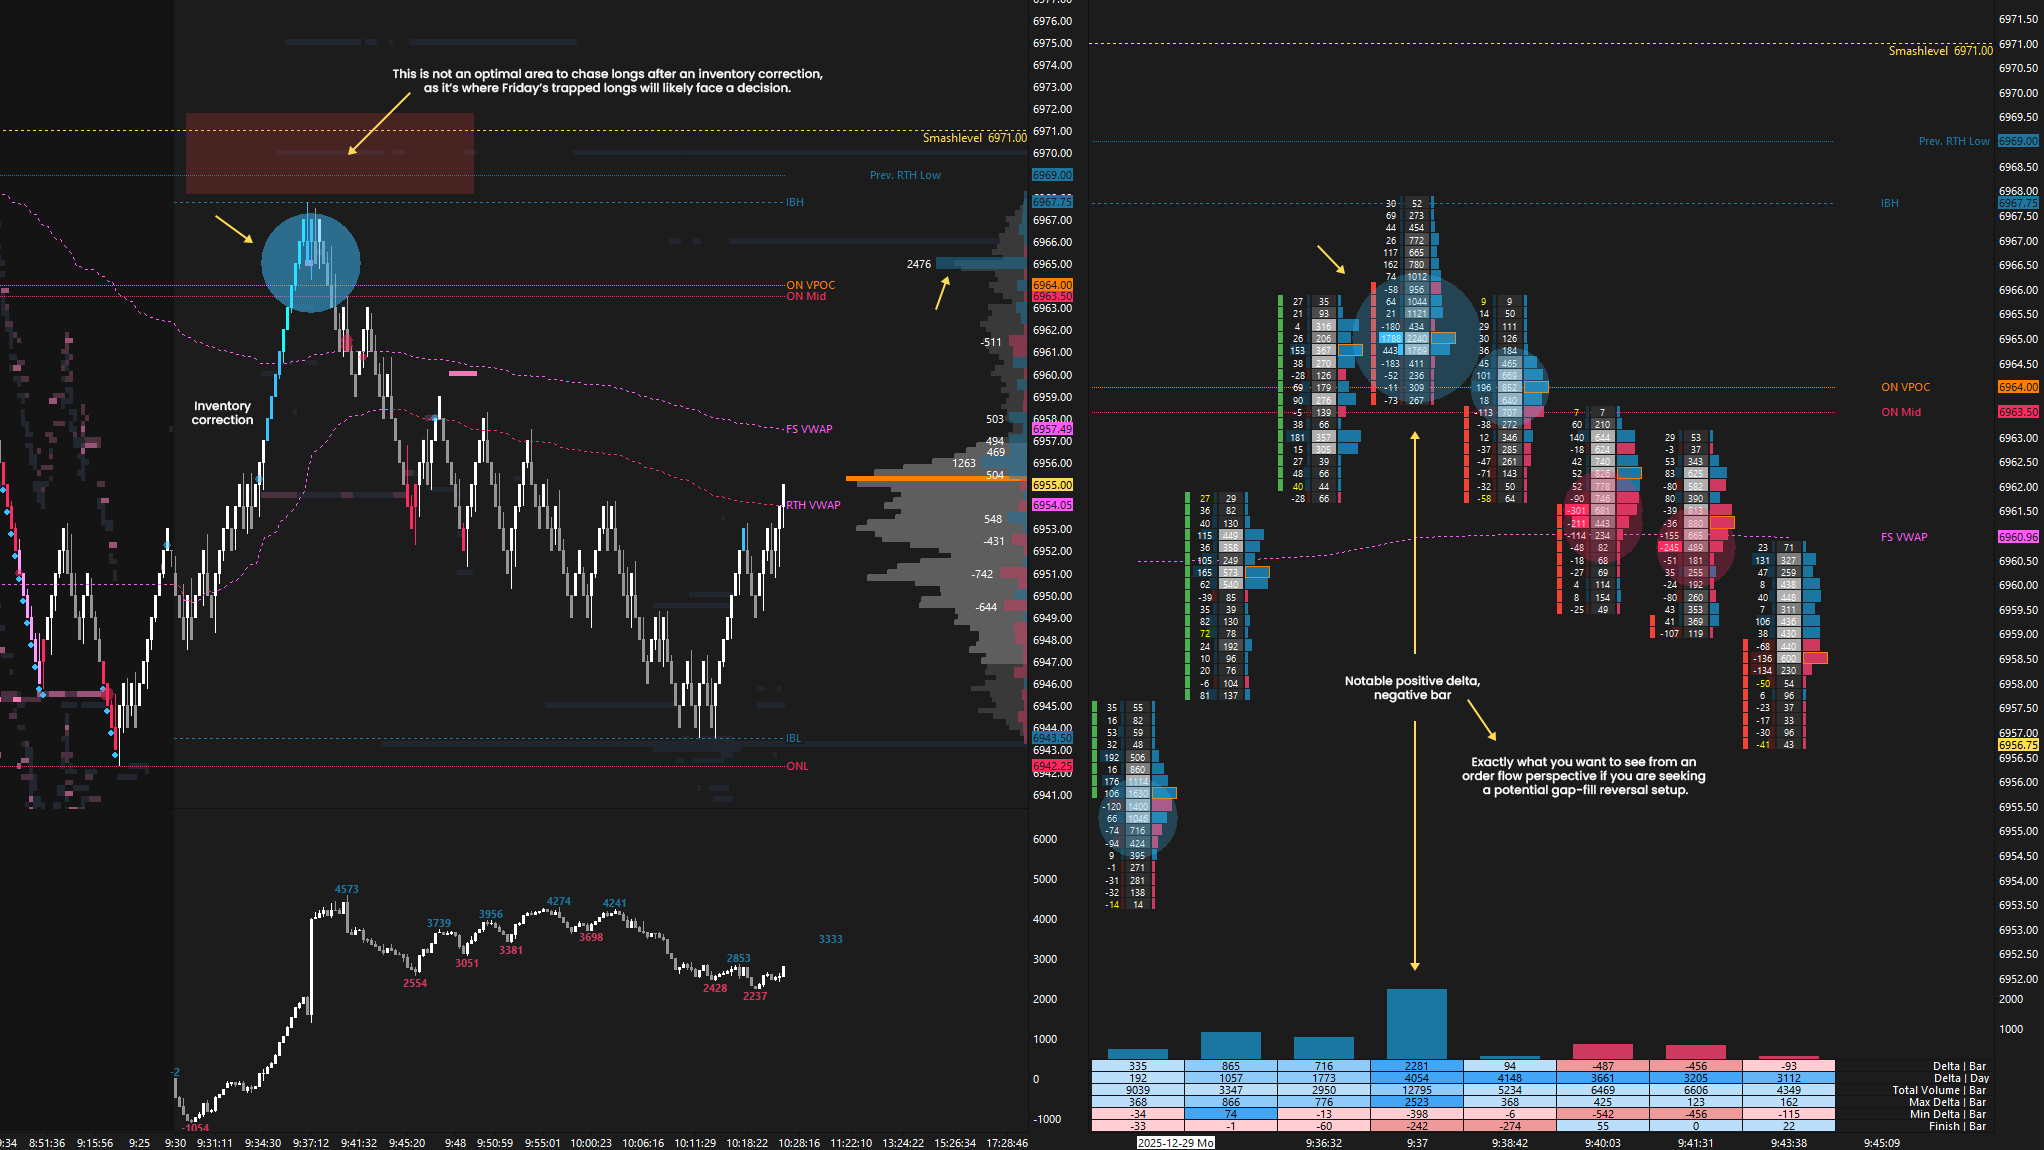
The RTH session opened on a true gap down, with buyers initially taking control of the opening level. This led to a classic inventory correction, defined as a move counter to the prevailing overnight direction. When gapping lower, an inventory correction is not bullish unless acceptance is established back within the prior day’s range—Friday’s range in this case. This move, which usually unfolds with good pace, is often mistaken for real buying when it is simply a correction of inventory, leading to trade initiation at poor locations.
The A-period provided a clean reversal setup just shy of the gap fill at 6969, slightly below the Smashlevel at 6971. Aggressive buyers were absorbed by a passive seller, triggering a reversal (see Figure 1). This was a textbook example of the risk of chasing an inventory correction at a poor location near the gap fill. Context sets the stage; order flow provides the confirmation.
The market ultimately broke the pattern of higher highs and higher lows following today’s true gap down, effectively cleaning up some of last week’s structural deficiencies in the process. The daily chart has now formed a 4-day balance area, and we now have a gap above at 6969 and one below at 6893.75. Buyers aim to negate the upside gap, while the downside gap potentially acts as a magnet if they fail to do so. Overall, buyers remain in control until acceptance is established below the downside gap.
In terms of levels, the Smashlevel is 6969—the unfilled gap. Holding below 6969 would target the prior ATH at 6952 (DT1). Acceptance below 6952 would signal weakness, targeting the HVN at 6930 (DT2), with a final downside target at 6911 (FDT) under sustained selling pressure.
On the flip side, reclaiming and holding above 6969 would signal strength, targeting 6987 (UT1), with a final upside target at 7015 (FUT)—the 100% IB extension—under sustained buying pressure.
Levels of Interest
Going into tomorrow’s session, I’ll closely observe the behavior around 6969.
Break and hold above 6969 would target 6987 / 7015
Holding below 6969 would target 6952 / 6930 / 6911
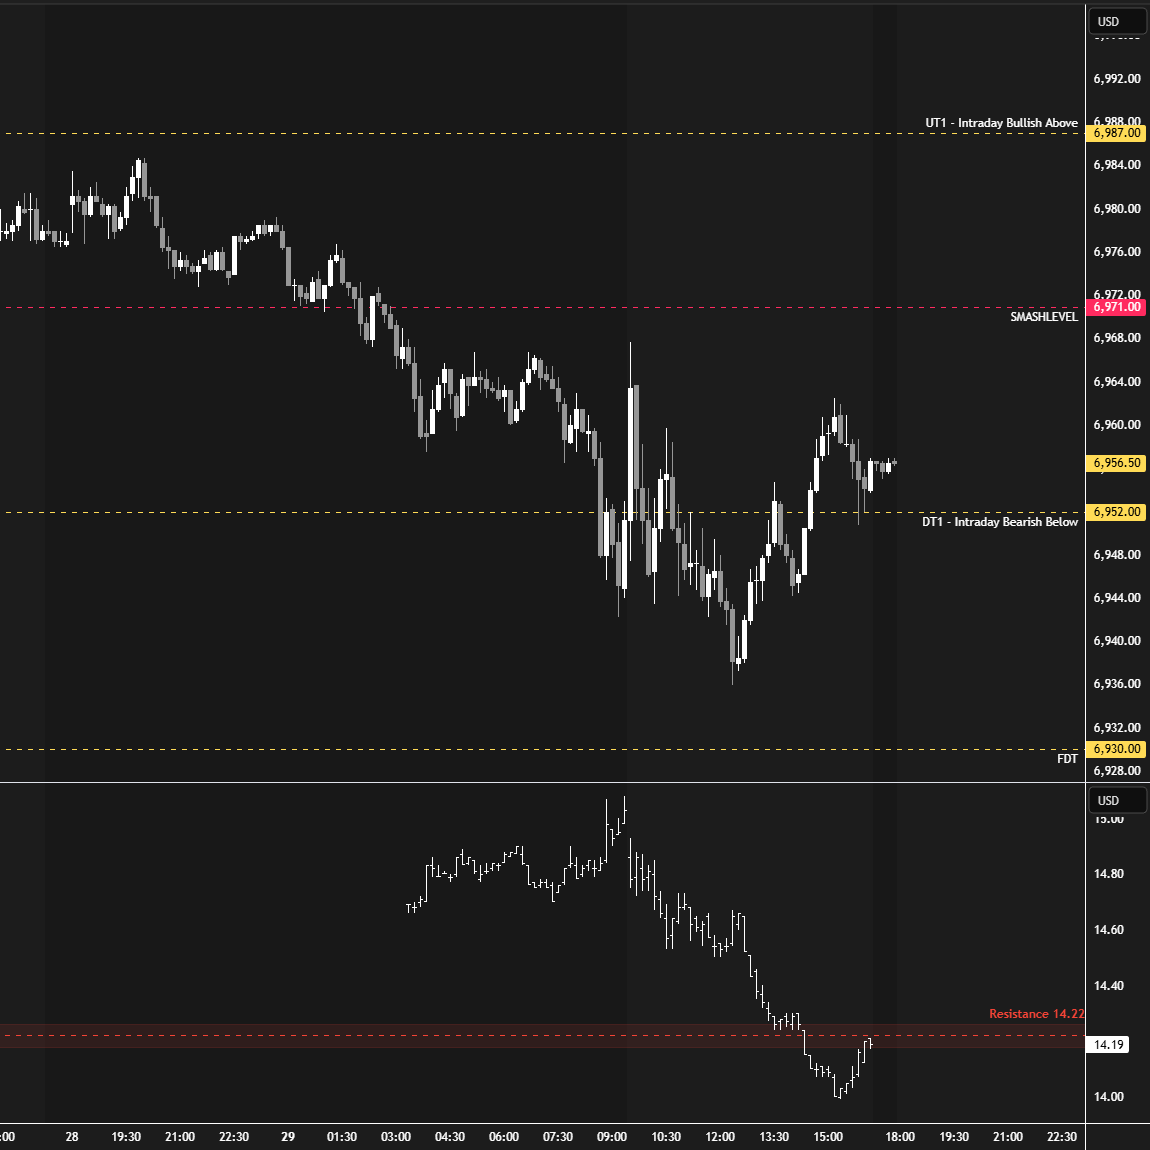
Additionally, pay attention to the following VIX levels: 14.84 and 13.56. These levels can provide confirmation of strength or weakness.
Break and hold above 7015 with VIX below 13.56 would confirm strength.
Break and hold below 6911 with VIX above 14.84 would confirm weakness.
Overall, it's important to exercise caution when trading outside of the highlighted yellow levels. A non-cooperative VIX may suggest possible reversals i.e trade setups.
Thanks Smash! Love the visuals!
Thanks Smash!