
ES Daily Plan | December 29, 2025
Market Context & Key Levels for the Day Ahead

— For new subscribers
The yellow levels highlighted at the bottom left of the chart are the primary intraday levels I focus on. To avoid impulsive decisions at poor trade locations, I follow a simple but effective rule: exercise caution when initiating trades outside of these yellow levels.
This means I’m cautious about chasing longs above the Final Upside Target (FUT) and shorts below the Final Downside Target (FDT). It’s important to understand that not chasing does not imply initiating a trade in the opposite direction — discipline over impulse.
Be sure to review the Weekly Plan for a broader perspective, key levels, and market expectations for the week ahead.

Contextual Analysis & Plan
Price responded well to our key levels on Wednesday and Friday, with the market continuing to print higher highs and higher lows on the daily chart. How much of the poor structure below—if any—is cleaned up will provide important market-generated information, especially now that the market has breached the prior all-time high at 6952.
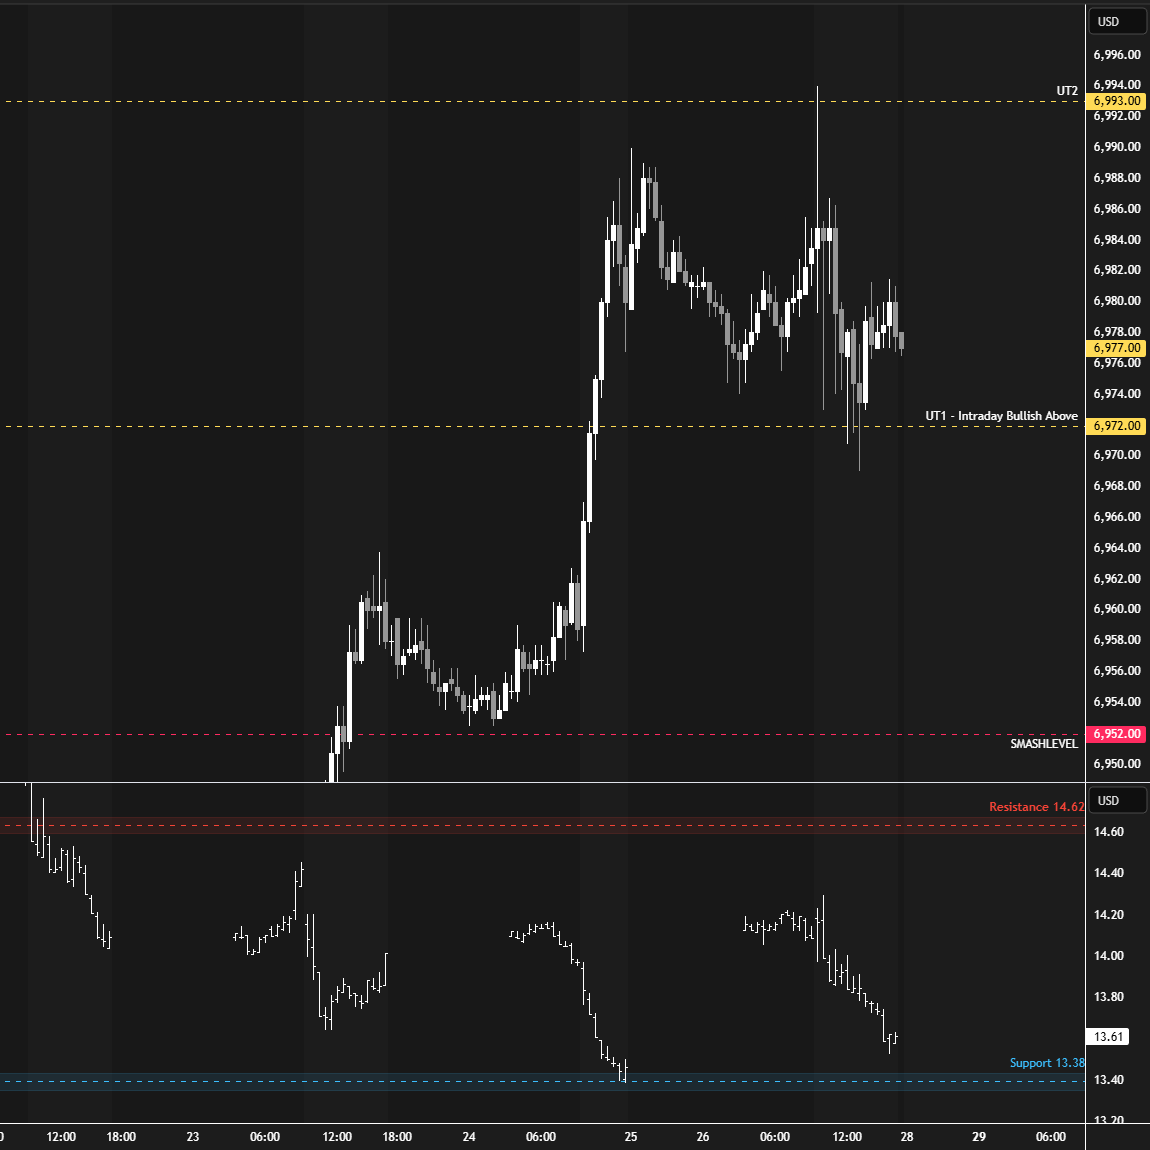
Friday’s session mostly traded within the range of Wednesday’s shortened session, following an early look-above-and-fail of Wednesday’s high. In the process, an excess high was formed—an important short-term reference to monitor. Looking at last week’s volume profile, the structural deficiencies are easy to spot. If Friday’s excess high remains intact, technical fills of this poor structure come into play. That said, the immediate levels of interest are 6987 and 6971 for clues on what the market wants next.
In terms of levels, the Smashlevel is 6971—the lower end of Friday’s range, closely aligning with Wednesday’s IB High. Holding above 6971 would signal strength and target Friday’s excess base at 6987 (UT1). Acceptance above 6987 would signal further strength, targeting the 100% IB extension at 7015 (UT2), with a final upside target at 7036 (FUT)—the 200% IB extension—under sustained buying pressure.
On the flip side, failure to hold 6971 would shift focus to the prior ATH at 6952 (DT1), with a final downside target at 6930 (FDT)—the high volume node—under sustained selling pressure.
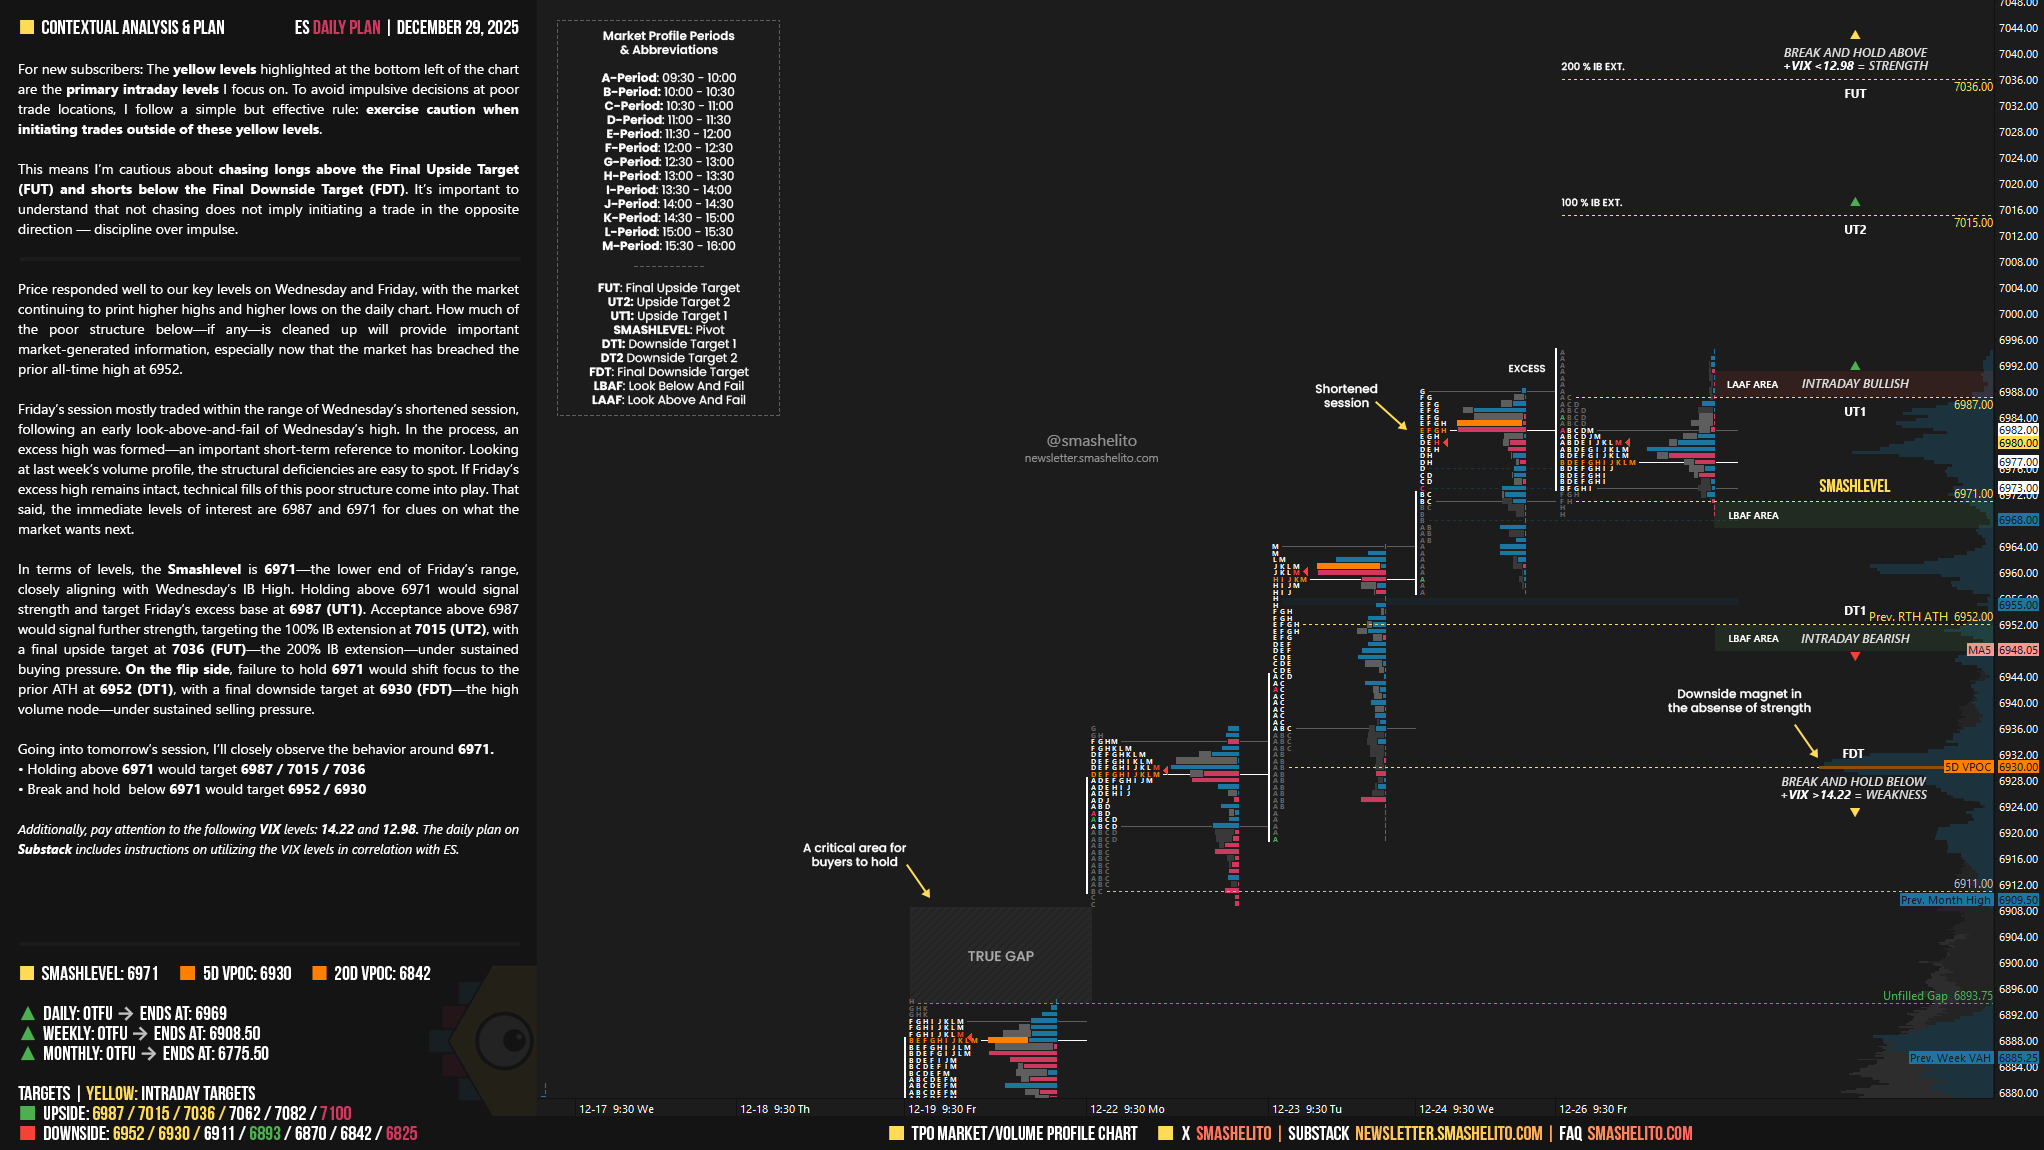
Levels of Interest
Going into tomorrow’s session, I’ll closely observe the behavior around 6971.
Holding above 6971 would target 6987 / 7015 / 7036
Break and hold below 6971 would target 6952 / 6930
Additionally, pay attention to the following VIX levels: 14.22 and 12.98. These levels can provide confirmation of strength or weakness.
Break and hold above 7036 with VIX below 12.98 would confirm strength.
Break and hold below 6930 with VIX above 14.22 would confirm weakness.
Overall, it's important to exercise caution when trading outside of the highlighted yellow levels. A non-cooperative VIX may suggest possible reversals i.e trade setups.
Hope everyone had an enjoyable Christmas let’s come back and SMASH it before the year ends…… once again thank you for all your hard work Smashelito.
Thank you!