

— For new subscribers
The yellow levels highlighted at the bottom left of the chart are the primary intraday levels I focus on. To avoid impulsive decisions at poor trade locations, I follow a simple but effective rule: exercise caution when initiating trades outside of these yellow levels.
This means I’m cautious about chasing longs above the Final Upside Target (FUT) and shorts below the Final Downside Target (FDT). It’s important to understand that not chasing does not imply initiating a trade in the opposite direction. Discipline over impulse.
Be sure to review the Weekly Plan for a broader perspective, key levels, and market expectations for the week ahead.

Contextual Analysis & Plan
This market does not wait for anyone. During the overnight session, the market consolidated Monday’s gains, not even coming close to testing 7611 (Smashlevel). The ATH at 7648 (UT1) was tested multiple times and found responsive sellers before buyers ultimately reclaimed it ahead of the RTH session.
We saw another true gap higher today, and just like Monday’s session, the market showed no interest in trading below the opening level, highlighting continued strength from buyers. The Weekly Extreme High at 7665 was breached during the A-period, and 7694 (FUT) during the B-period. These are the type of sessions that are very difficult to trade if you are not already positioned from overnight or early in RTH. When markets become emotional, in either direction, there’s no shame in stepping back and letting other traders handle in the price discovery process.
To put things in perspective, we are now 400+ handles off Wednesday’s low and trading 100+ handles above the Weekly Extreme High at 7665. Monday’s profile contained 3 sets of single prints, while today’s profile contained 7. We are also trading 300+ handles above both the 5D and 20D VPOCs. What makes this environment more complex is that we are breaking out of a multi-week balance area, meaning buyers are currently in firm control of the auction. Shorting is not an optimal approach until that behavior changes, defined by a failed breakout and acceptance back below the prior ATH at 7648. My only advice is to mind your step and keep a level-to-level mindset.
Session Recap
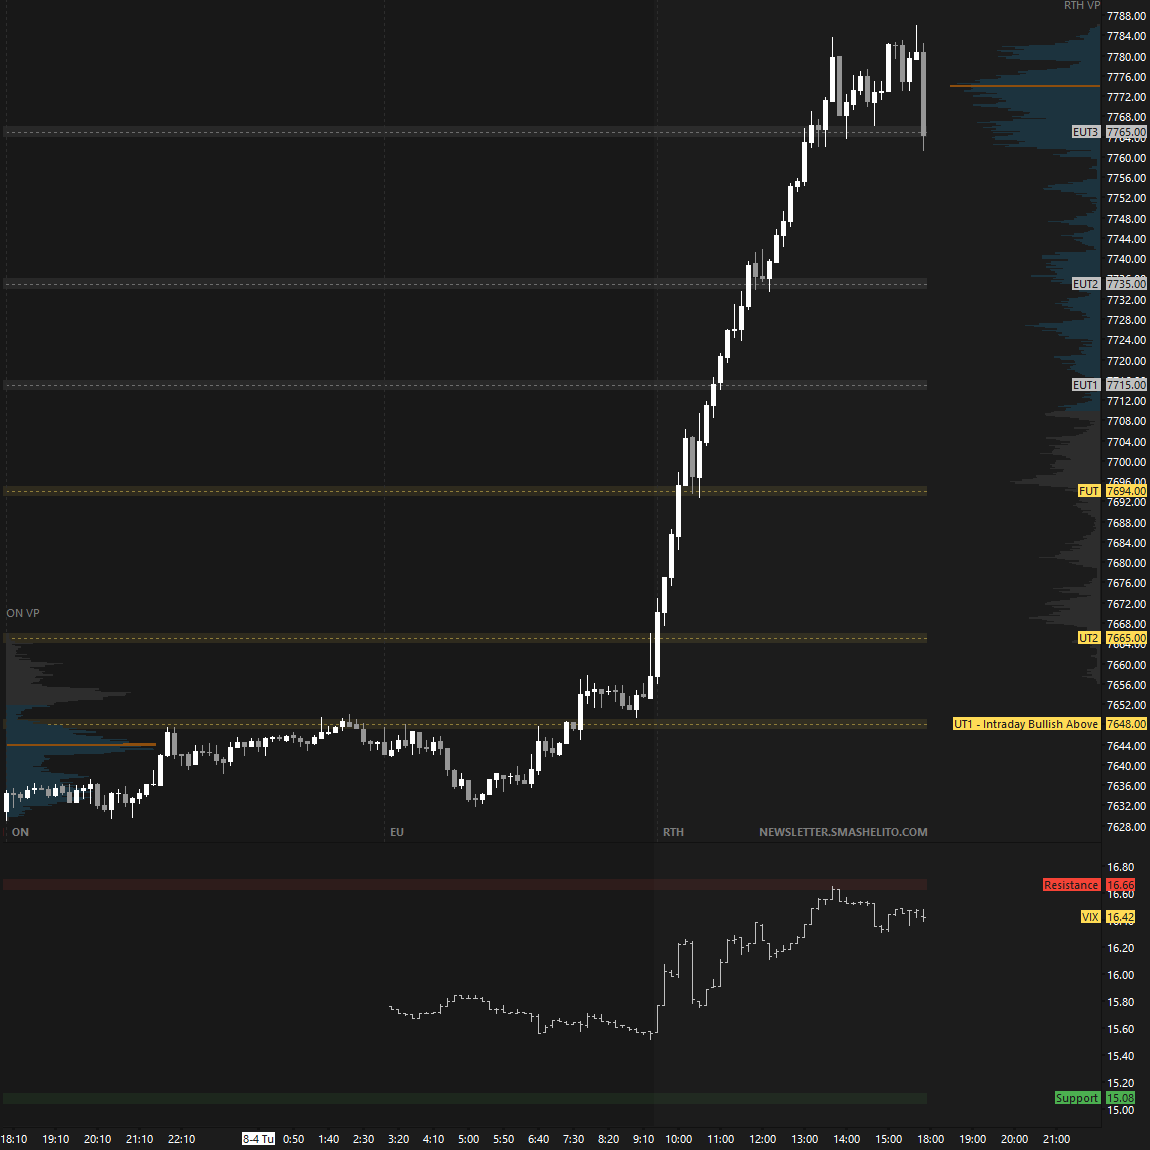
A second consecutive true gap higher today, and this time the market gapped above the ATH, triggering a vicious squeeze into uncharted territory.
The market is one-time framing up across all timeframes, signaling strength. However, this is emotional price action, so mind your step and remain level-to-level.
Contextually, only acceptance back within the multi-week balance area would introduce weakness, meaning we could see a sizable pullback without necessarily becoming meaningfully bearish.
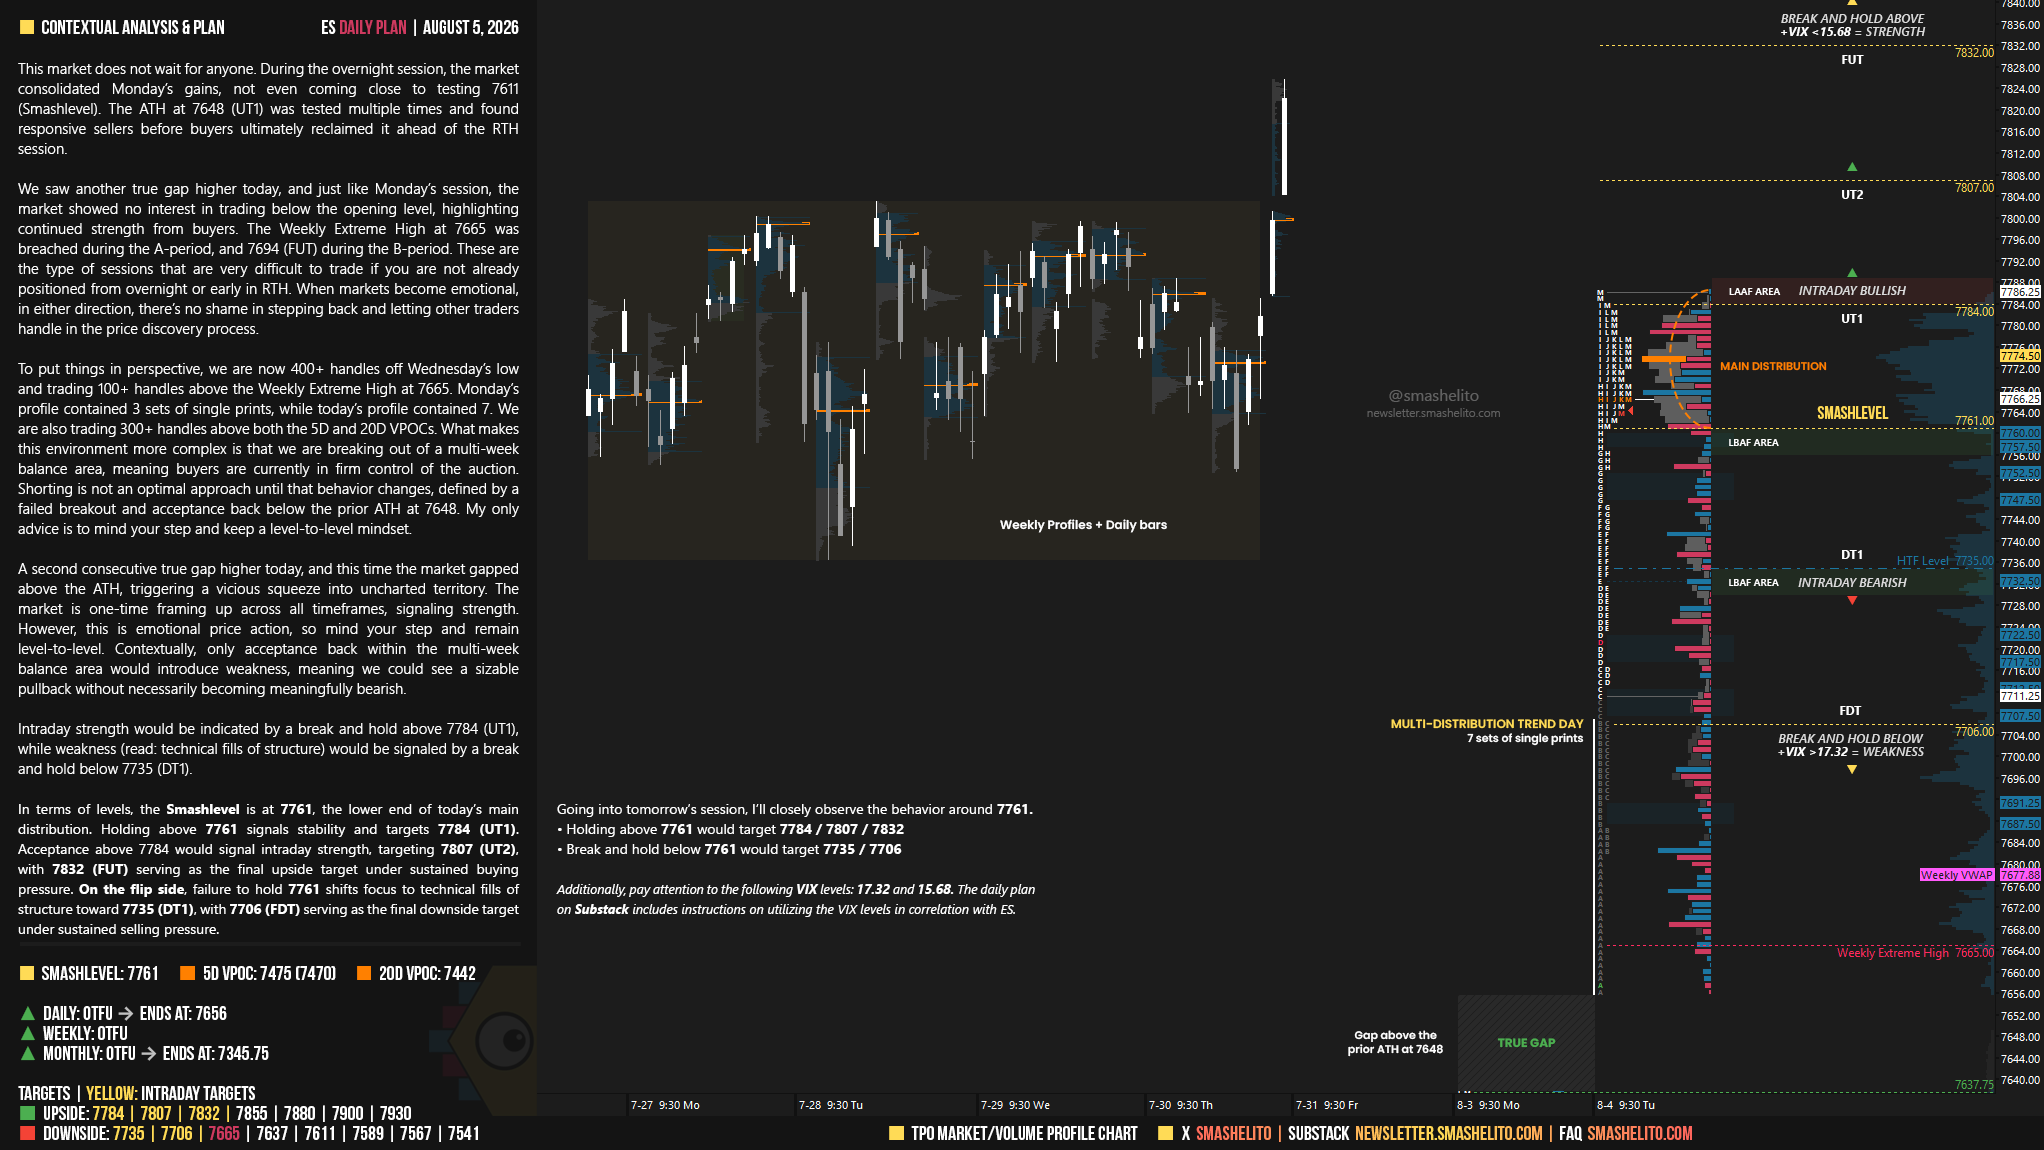
Intraday strength would be indicated by a break and hold above 7784 (UT1), while weakness (read: technical fills of structure) would be signaled by a break and hold below 7735 (DT1).
In terms of levels, the Smashlevel is at 7761, the lower end of today’s main distribution. Holding above 7761 signals stability and targets 7784 (UT1). Acceptance above 7784 would signal intraday strength, targeting 7807 (UT2), with 7832 (FUT) serving as the final upside target under sustained buying pressure.
On the flip side, failure to hold 7761 shifts focus to technical fills of structure toward 7735 (DT1), with 7706 (FDT) serving as the final downside target under sustained selling pressure.
Visual Representation
Levels of Interest
Going into tomorrow’s session, I’ll closely observe the behavior around 7761.
Holding above 7761 would target 7784 / 7807 / 7832
Break and hold below 7761 would target 7735 / 7706
Additionally, pay attention to the following VIX levels: 17.32 and 15.68 These levels can provide confirmation of strength or weakness.
Break and hold above 7832 with VIX below 15.68 would confirm strength.
Break and hold below 7706 with VIX above 17.32 would confirm weakness.
Overall, it's important to exercise caution when trading outside of the highlighted yellow levels. A non-cooperative VIX may suggest possible reversals i.e trade setups.
Do you have any thoughts on why the VIX was running up as well? It seemed odd/dangerous for longs that it was for some time. Also, do you use GEX levels for your roadmap? Very curious to know whether you use them, and if not, why.
Thanks Smash! Good advice about emotional markets and treading lightly. What's that phrase about the market staying irrational longer than we can stay solvent? :)