ES Daily Plan | August 29, 2024
My preparations and expectations for the upcoming session.
For new followers: The yellow levels highlighted at the bottom left of the chart are the primary levels that I focus on intraday. My strategy for preventing impulsive decisions at unfavorable locations involves following a simple yet effective rule of exercising caution when initiating trades outside of the yellow levels. This implies that I am cautious chasing longs above the final yellow upside target and shorts below the final yellow downside target. It is crucial to understand that refraining from chasing a trade is not an automatic invitation to initiate a trade in the opposite direction.
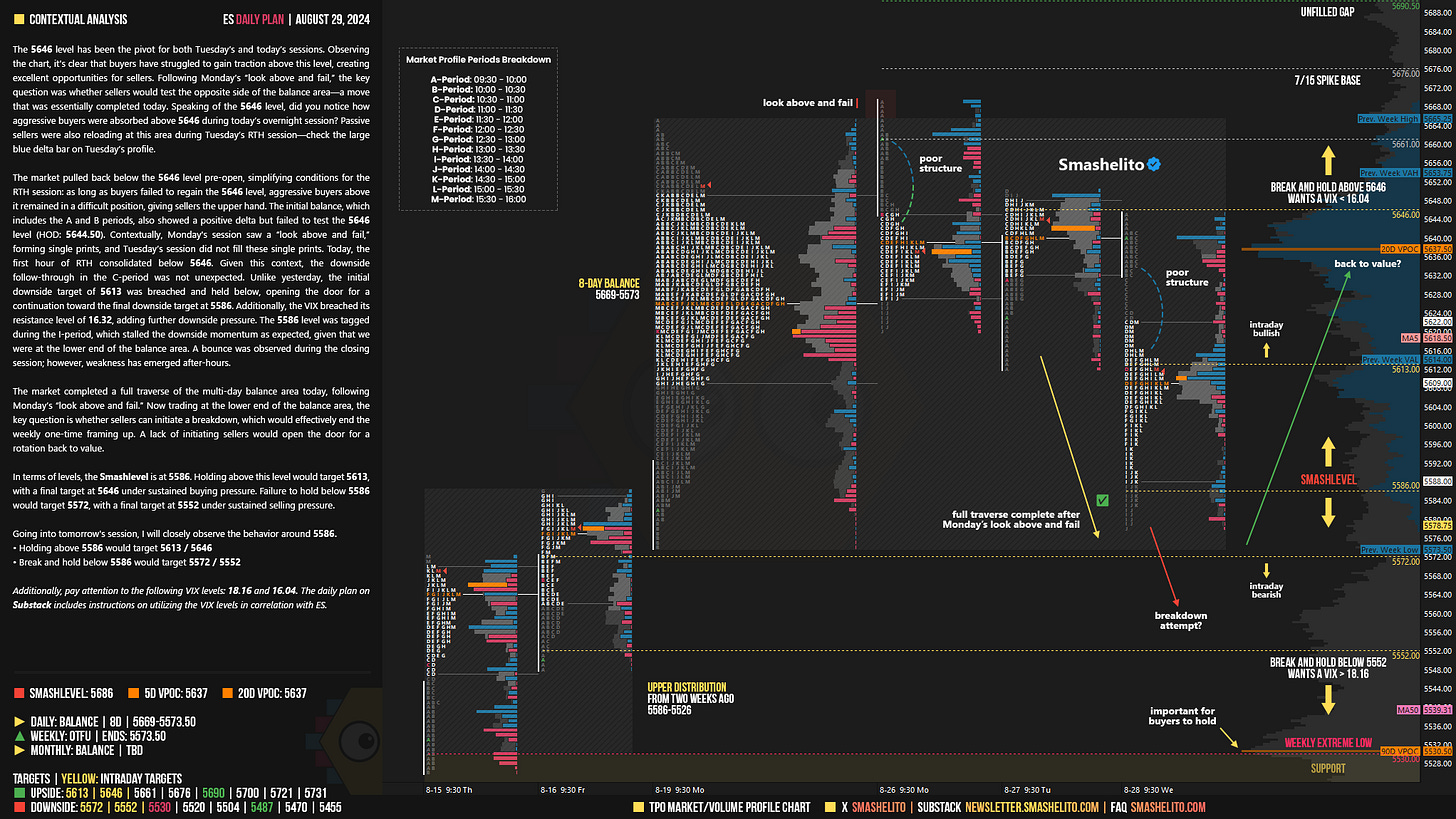
Visual Representation
Contextual Analysis
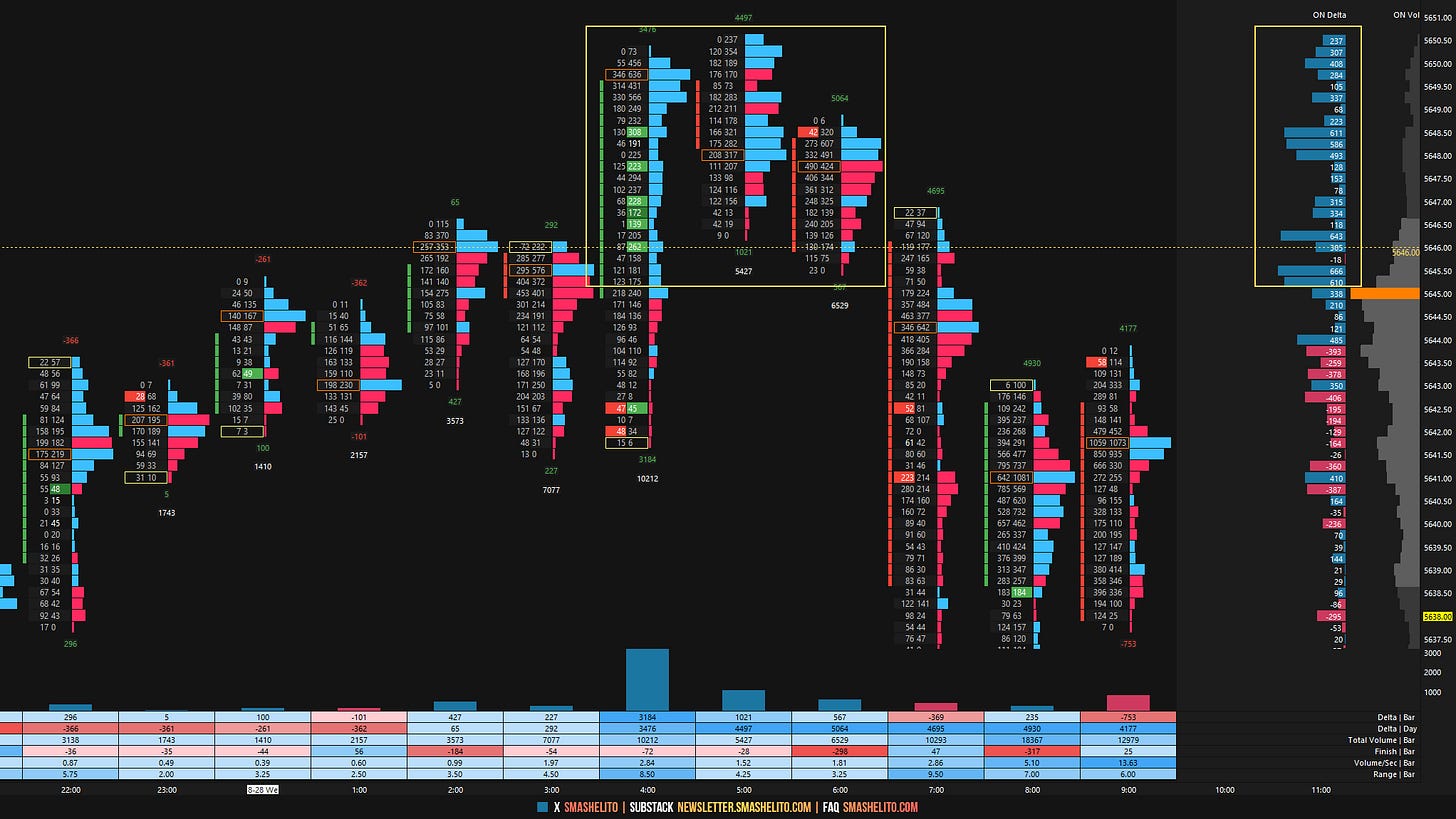
The 5646 level has been the pivot for both Tuesday’s and today’s sessions. Observing the chart, it's clear that buyers have struggled to gain traction above this level, creating excellent opportunities for sellers. Following Monday’s “look above and fail,” the key question was whether sellers would test the opposite side of the balance area—a move that was essentially completed today. Speaking of the 5646 level, did you notice how aggressive buyers were absorbed above 5646 during today’s overnight session? Passive sellers were also reloading at this area during Tuesday’s RTH session—check the large blue delta bar on Tuesday’s profile.
The market pulled back below the 5646 level pre-open, simplifying conditions for the RTH session: as long as buyers failed to regain the 5646 level, aggressive buyers above it remained in a difficult position, giving sellers the upper hand. The initial balance, which includes the A and B periods, also showed a positive delta but failed to test the 5646 level (HOD: 5644.50). Contextually, Monday's session saw a “look above and fail,” forming single prints, and Tuesday’s session did not fill these single prints. Today, the first hour of RTH consolidated below 5646. Given this context, the downside follow-through in the C-period was not unexpected. Unlike yesterday, the initial downside target of 5613 was breached and held below, opening the door for a continuation toward the final downside target at 5586. Additionally, the VIX breached its resistance level of 16.32, adding further downside pressure. The 5586 level was tagged during the I-period, which stalled the downside momentum as expected, given that we were at the lower end of the balance area. A bounce was observed during the closing session; however, weakness has emerged after-hours.
The market completed a full traverse of the multi-day balance area today, following Monday’s “look above and fail.” Now trading at the lower end of the balance area, the key question is whether sellers can initiate a breakdown, which would effectively end the weekly one-time framing up. A lack of initiating sellers would open the door for a rotation back to value.
In terms of levels, the Smashlevel is at 5586. Holding above this level would target 5613, with a final target at 5646 under sustained buying pressure. Failure to hold below 5586 would target 5572, with a final target at 5552 under sustained selling pressure.
Levels of Interest
Going into tomorrow's session, I will closely observe the behavior around 5586.
Holding above 5586 would target 5613 / 5646
Break and hold below 5586 would target 5572 / 5552
Additionally, pay attention to the following VIX levels: 18.16 and 16.04. These levels can provide confirmation of strength or weakness.
Break and hold above 5646 with VIX below 16.04 would confirm strength.
Break and hold below 5552 with VIX above 18.16 would confirm weakness.
Overall, it's important to exercise caution when trading outside of the highlighted yellow levels. A non-cooperative VIX may suggest possible reversals i.e trade setups.
Weekly Plan
Make sure to review the Weekly Plan, which provides a broader perspective and highlights key levels of interest to observe in the upcoming week.


Thank you! Sellers already breaking down!