

— For new subscribers
The yellow levels highlighted at the bottom left of the chart are the primary intraday levels I focus on. To avoid impulsive decisions at poor trade locations, I follow a simple but effective rule: exercise caution when initiating trades outside of these yellow levels.
This means I’m cautious about chasing longs above the Final Upside Target (FUT) and shorts below the Final Downside Target (FDT). It’s important to understand that not chasing does not imply initiating a trade in the opposite direction. Discipline over impulse.
Be sure to review the Weekly Plan for a broader perspective, key levels, and market expectations for the week ahead.

Contextual Analysis & Plan
Monday’s double-distribution trend day lower, which rejected last week’s late strength, saw immediate downside continuation overnight after failing to even test the aggressive resistance at 7772 (ONH: 7770.25). The potential scenario involved a rotation toward the lower end of the prior multi-day balance (7725), which was already achieved ahead of the RTH open. Responsive buyers stepped in at 7725 (DT2), but buyers were ultimately unable to generate a meaningful bounce.
The RTH session opened with a sizable true gap down, a condition that often triggers an inventory correction after the open. Failure to see a meaningful counter-auction is a bearish indication, suggesting that the overnight inventory remains in control. The RTH session was rather uneventful, as we saw neither an inventory correction nor meaningful downside continuation. Instead, the auction spent most of the day trading around the 7725 level, building a distribution. The closing weakness came a few handles shy of the FDT at 7706, partially cleaning up the poor structure from August 4. The daily is now one-time framing down, while the weekly timeframe is back in balance after ending its one-time framing higher.
Session Recap
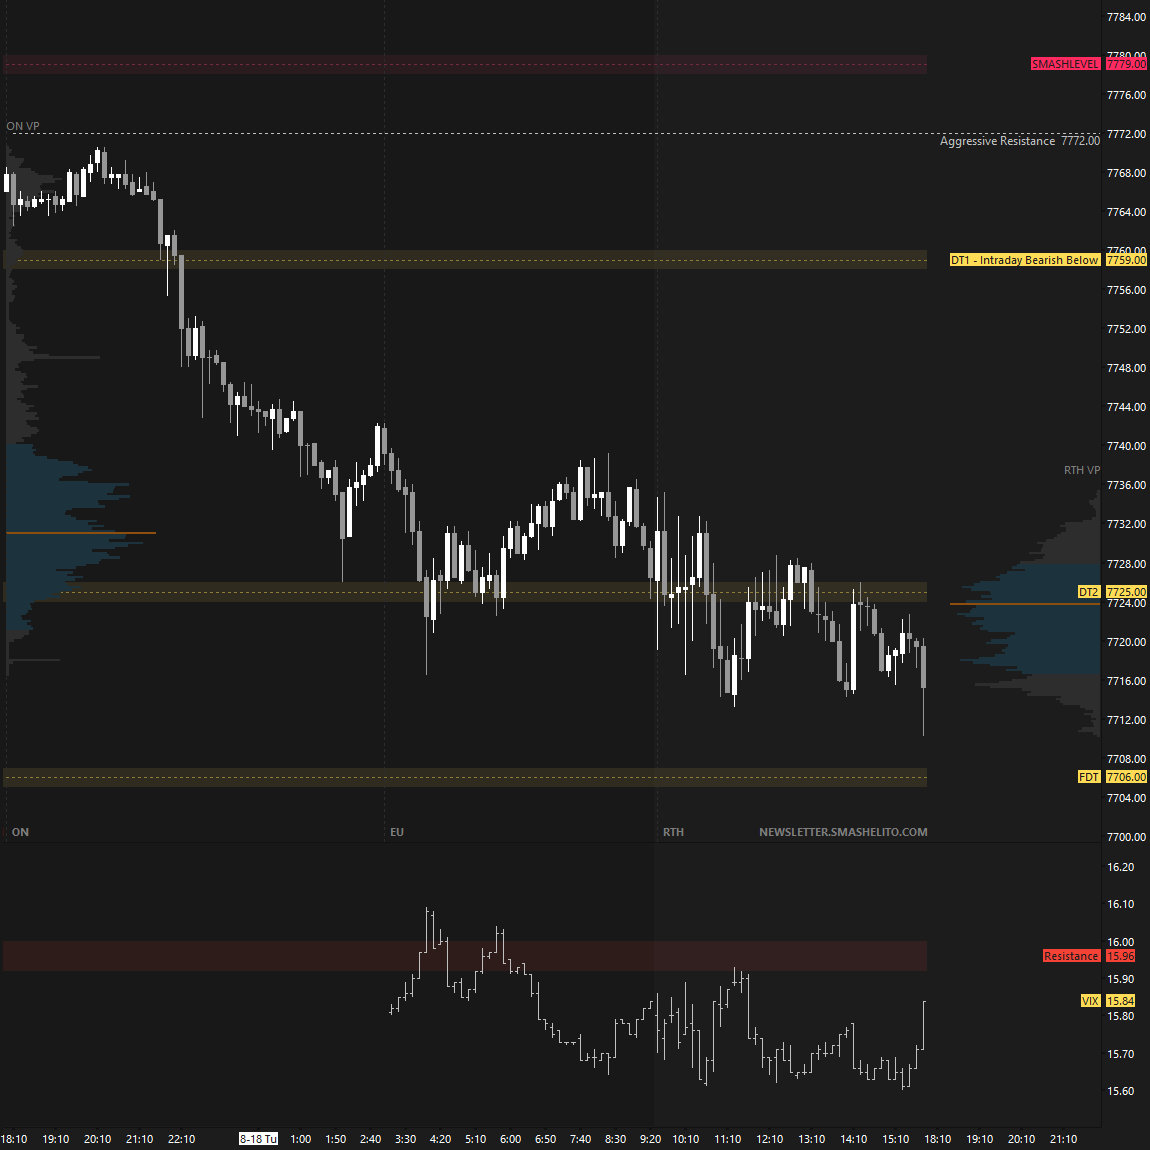
Today’s session saw downside continuation after a true gap down, completing the bearish scenario with a rotation toward the prior multi-day balance low and partially cleaning up the poor structure from August 4 in the process.
The key question now is which gap will be filled first: today’s bear gap at 7766.25 or the bull gap at 7637.75. This makes value development relative to today’s value particularly important to monitor in the short term.
Intraday strength would be indicated by a reclaim of 7750 (UT1), while weakness would be signaled by a break and hold below 7706 (DT1).
In terms of levels, the Smashlevel is at 7726, today’s opening level, which aligns with the afternoon rally high and FS VWAP. Holding below 7726 targets 7706 (DT1). Acceptance below 7706 would signal intraday weakness, targeting 7681 (DT2), with 7637 (FDT) serving as the final downside target under sustained selling pressure.
On the flip side, reclaiming and holding above 7726 shifts focus to 7750 (UT1). Acceptance above 7750 would signal intraday strength, targeting 7766 (UT2), with 7779 (FUT) serving as the final upside target under sustained buying pressure.
Visual Representation
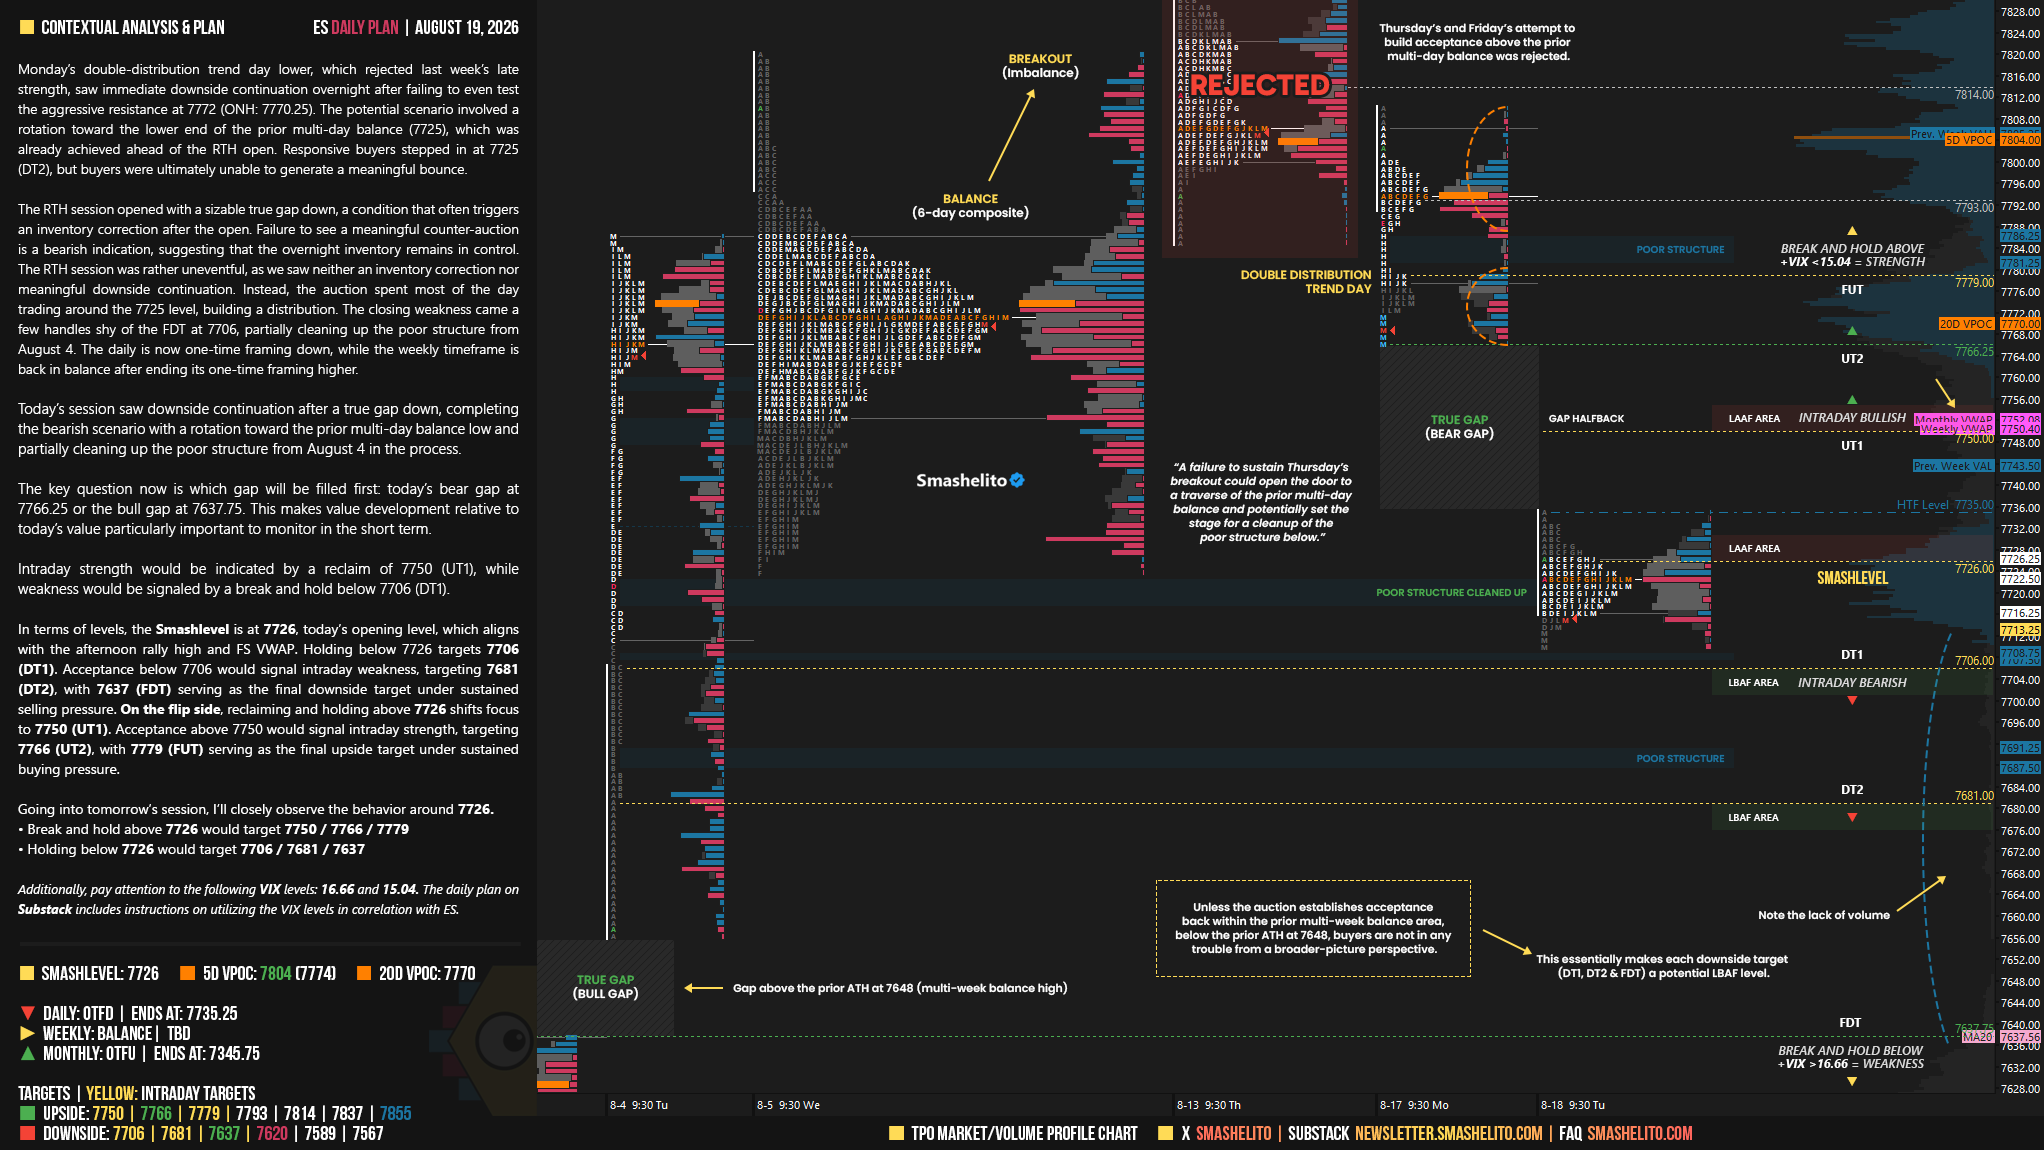
Levels of Interest
Going into tomorrow’s session, I’ll closely observe the behavior around 7726.
Break and hold above 7726 would target 7750 / 7766 / 7779
Holding below 7726 would target 7706 / 7681 / 7637
Additionally, pay attention to the following VIX levels: 16.66 and 15.04. These levels can provide confirmation of strength or weakness.
Break and hold above 7779 with VIX below 15.04 would confirm strength.
Break and hold below 7637 with VIX above 16.66 would confirm weakness.
Overall, it's important to exercise caution when trading outside of the highlighted yellow levels. A non-cooperative VIX may suggest possible reversals i.e trade setups.
Great insight
Thank you
It started at 9 pm EST of the previous day. Most selling had been achieved in the Asian and London sessions, and NY bulls were on strike - which makes me suspect that this Aug market has been driven by hedge funds squeezing market makers and selling, but no institutions positioning.