

— For new subscribers
The yellow levels highlighted at the bottom left of the chart are the primary intraday levels I focus on. To avoid impulsive decisions at poor trade locations, I follow a simple but effective rule: exercise caution when initiating trades outside of these yellow levels.
This means I’m cautious about chasing longs above the Final Upside Target (FUT) and shorts below the Final Downside Target (FDT). It’s important to understand that not chasing does not imply initiating a trade in the opposite direction. Discipline over impulse.
Be sure to review the Weekly Plan for a broader perspective, key levels, and market expectations for the week ahead.

Contextual Analysis & Plan
Trading activity during the overnight session remained contained within Friday’s range, with 7814 (Smashlevel) acting as a key pivot. Buyers controlled the level throughout the European session but lost it ahead of the RTH open following a move driven by news headlines.
The RTH session opened near the lower end of Friday’s range, with Friday’s low taken out rather quickly, leading to a test of the crucial 7793 (DT1) level separating last week’s distributions. The auction notably stalled at 7793, where it spent the morning chopping around. Passive buyers were present in the 7793–7789 area, where we expected buyers to defend. This provided a couple of opportunities to look for long entries, but buyers ultimately failed to gain traction back into Friday’s range. The VIX was hovering around its resistance level at 15.02 at the time. Change took place in the H-period, as the market broke down from the distribution built around 7793. This resulted in a quick move down to the high volume node at 7774 (DT2), which had been identified as a downside magnet if last week’s late breakout failed to hold.
Session Recap
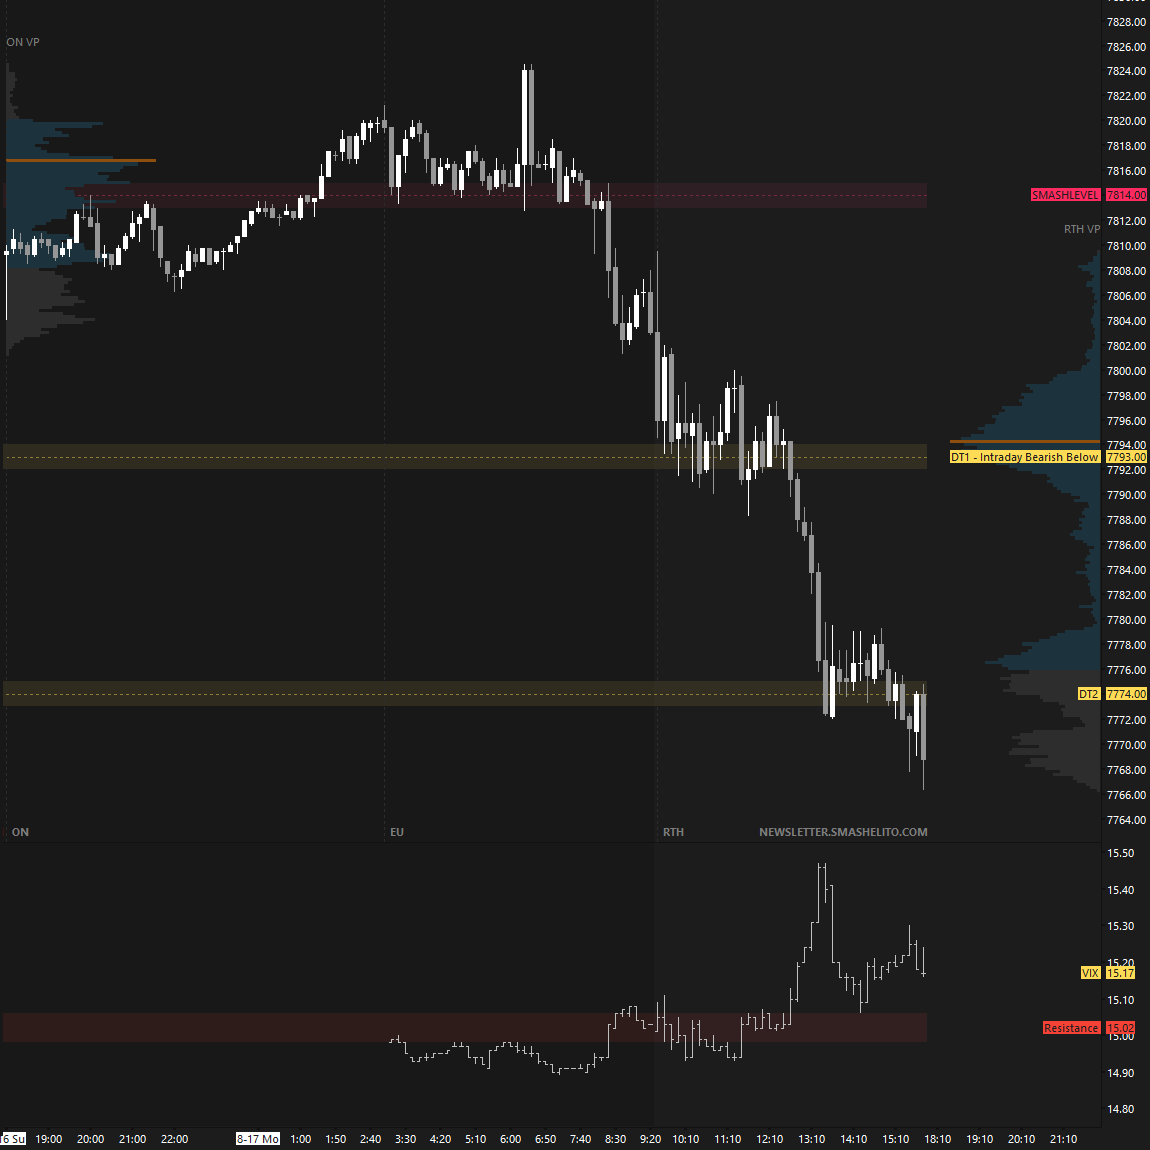
Today’s session was a great example of auction dynamics: markets transition from balance to imbalance, but when that imbalance fails, price often returns to the prior balance area where value was established—in this case, the HVN at 7774. A double distribution profile was formed in the process, with single prints developing in the H-period.
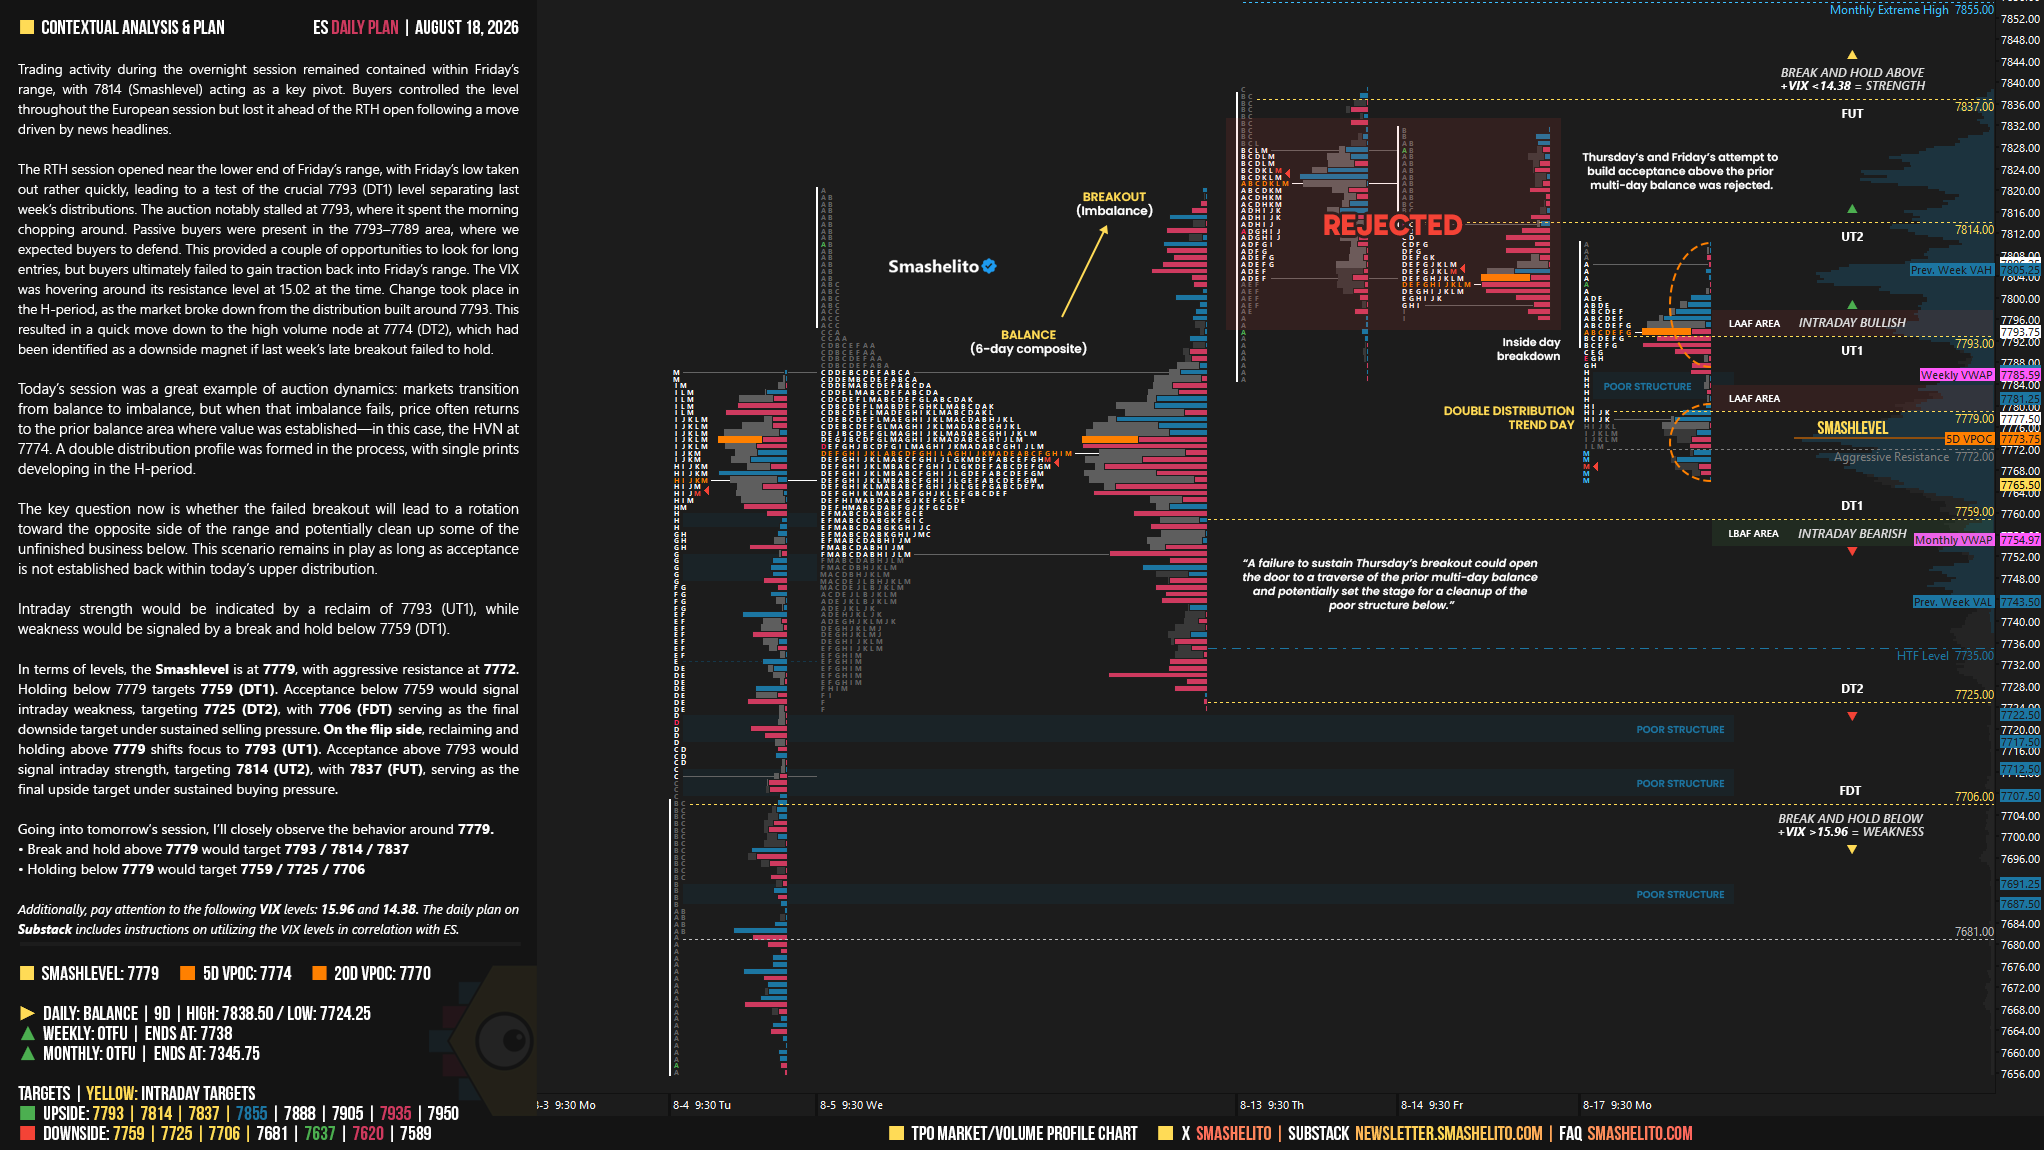
The key question now is whether the failed breakout will lead to a rotation toward the opposite side of the range and potentially clean up some of the unfinished business below. This scenario remains in play as long as acceptance is not established back within today’s upper distribution.
Intraday strength would be indicated by a reclaim of 7793 (UT1), while weakness would be signaled by a break and hold below 7759 (DT1).
In terms of levels, the Smashlevel is at 7779, with aggressive resistance at 7772. Holding below 7779 targets 7759 (DT1). Acceptance below 7759 would signal intraday weakness, targeting 7725 (DT2), with 7706 (FDT) serving as the final downside target under sustained selling pressure.
On the flip side, reclaiming and holding above 7779 shifts focus to 7793 (UT1). Acceptance above 7793 would signal intraday strength, targeting 7814 (UT2), with 7837 (FUT), serving as the final upside target under sustained buying pressure.
Visual Representation
Levels of Interest
Going into tomorrow’s session, I’ll closely observe the behavior around 7779.
Break and hold above 7779 would target 7793 / 7814 / 7837
Holding below 7779 would target 7759 / 7725 / 7706
Additionally, pay attention to the following VIX levels: 15.96 and 14.38. These levels can provide confirmation of strength or weakness.
Break and hold above 7837 with VIX below 14.38 would confirm strength.
Break and hold below 7706 with VIX above 15.96 would confirm weakness.
Overall, it's important to exercise caution when trading outside of the highlighted yellow levels. A non-cooperative VIX may suggest possible reversals i.e trade setups.
Thank you!
Thanks Smash