

— For new subscribers
The yellow levels highlighted at the bottom left of the chart are the primary intraday levels I focus on. To avoid impulsive decisions at poor trade locations, I follow a simple but effective rule: exercise caution when initiating trades outside of these yellow levels.
This means I’m cautious about chasing longs above the Final Upside Target (FUT) and shorts below the Final Downside Target (FDT). It’s important to understand that not chasing does not imply initiating a trade in the opposite direction. Discipline over impulse.
Be sure to review the Weekly Plan for a broader perspective, key levels, and market expectations for the week ahead.

Contextual Analysis & Plan
A breakout in the direction of the prevailing trend occurred on Thursday, printing new all-time highs in the process. The market is one-time framing higher across all time frames, signaling strength until proven otherwise. Friday’s session consolidated Thursday’s gains, forming an inside day, which technically does not end the daily one-time framing higher. However, it does suggest short-term balance.
Session Recap
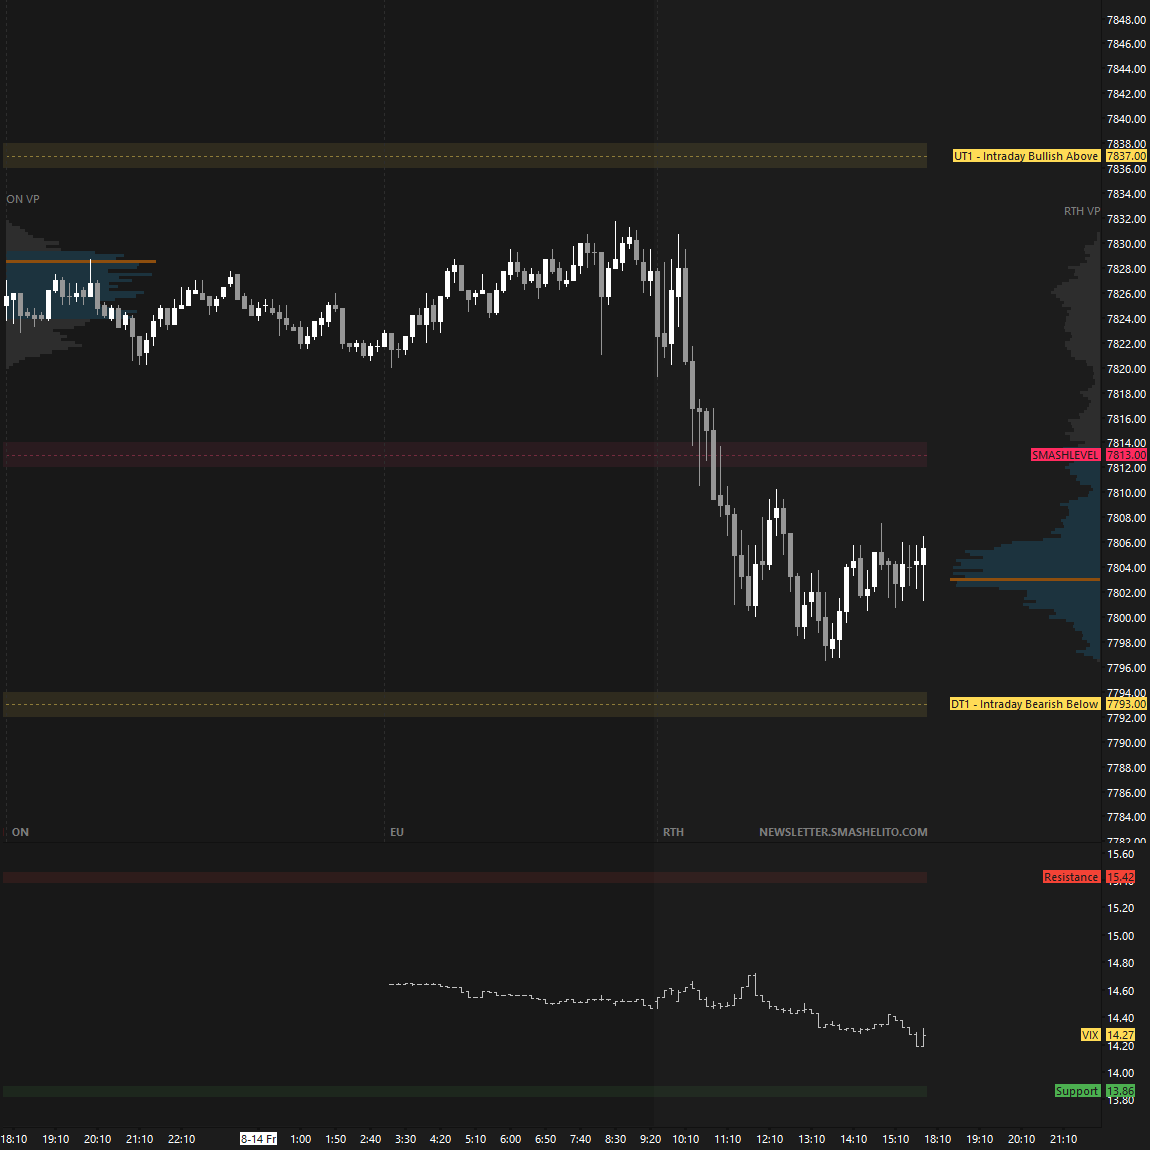
As we’ve discussed, last week’s price action can be separated into two distributions. Thursday’s breakout and Friday’s inside day mark the upper distribution, while the lower distribution essentially represents the high volume area where most of the volume was traded over the past two weeks. Value development relative to the low volume node separating the two distributions will be key to monitor in the short term.
Intraday strength would be indicated by a break and hold above 7837 (UT1), while weakness would be signaled by a break and hold below 7793 (DT1).
In terms of levels, the Smashlevel is at 7814, Friday’s IB low. Holding below 7814 targets the LVN at 7793 (DT1). Acceptance below 7793 would signal intraday weakness, targeting 7774 (DT2), with 7759 (FDT) serving as the final downside target under sustained selling pressure.
On the flip side, reclaiming and holding above 7814 shifts focus to 7837 (UT1), with 7855 (FUT), the Monthly Extreme High, serving as the final upside target under sustained buying pressure.
Visual Representation
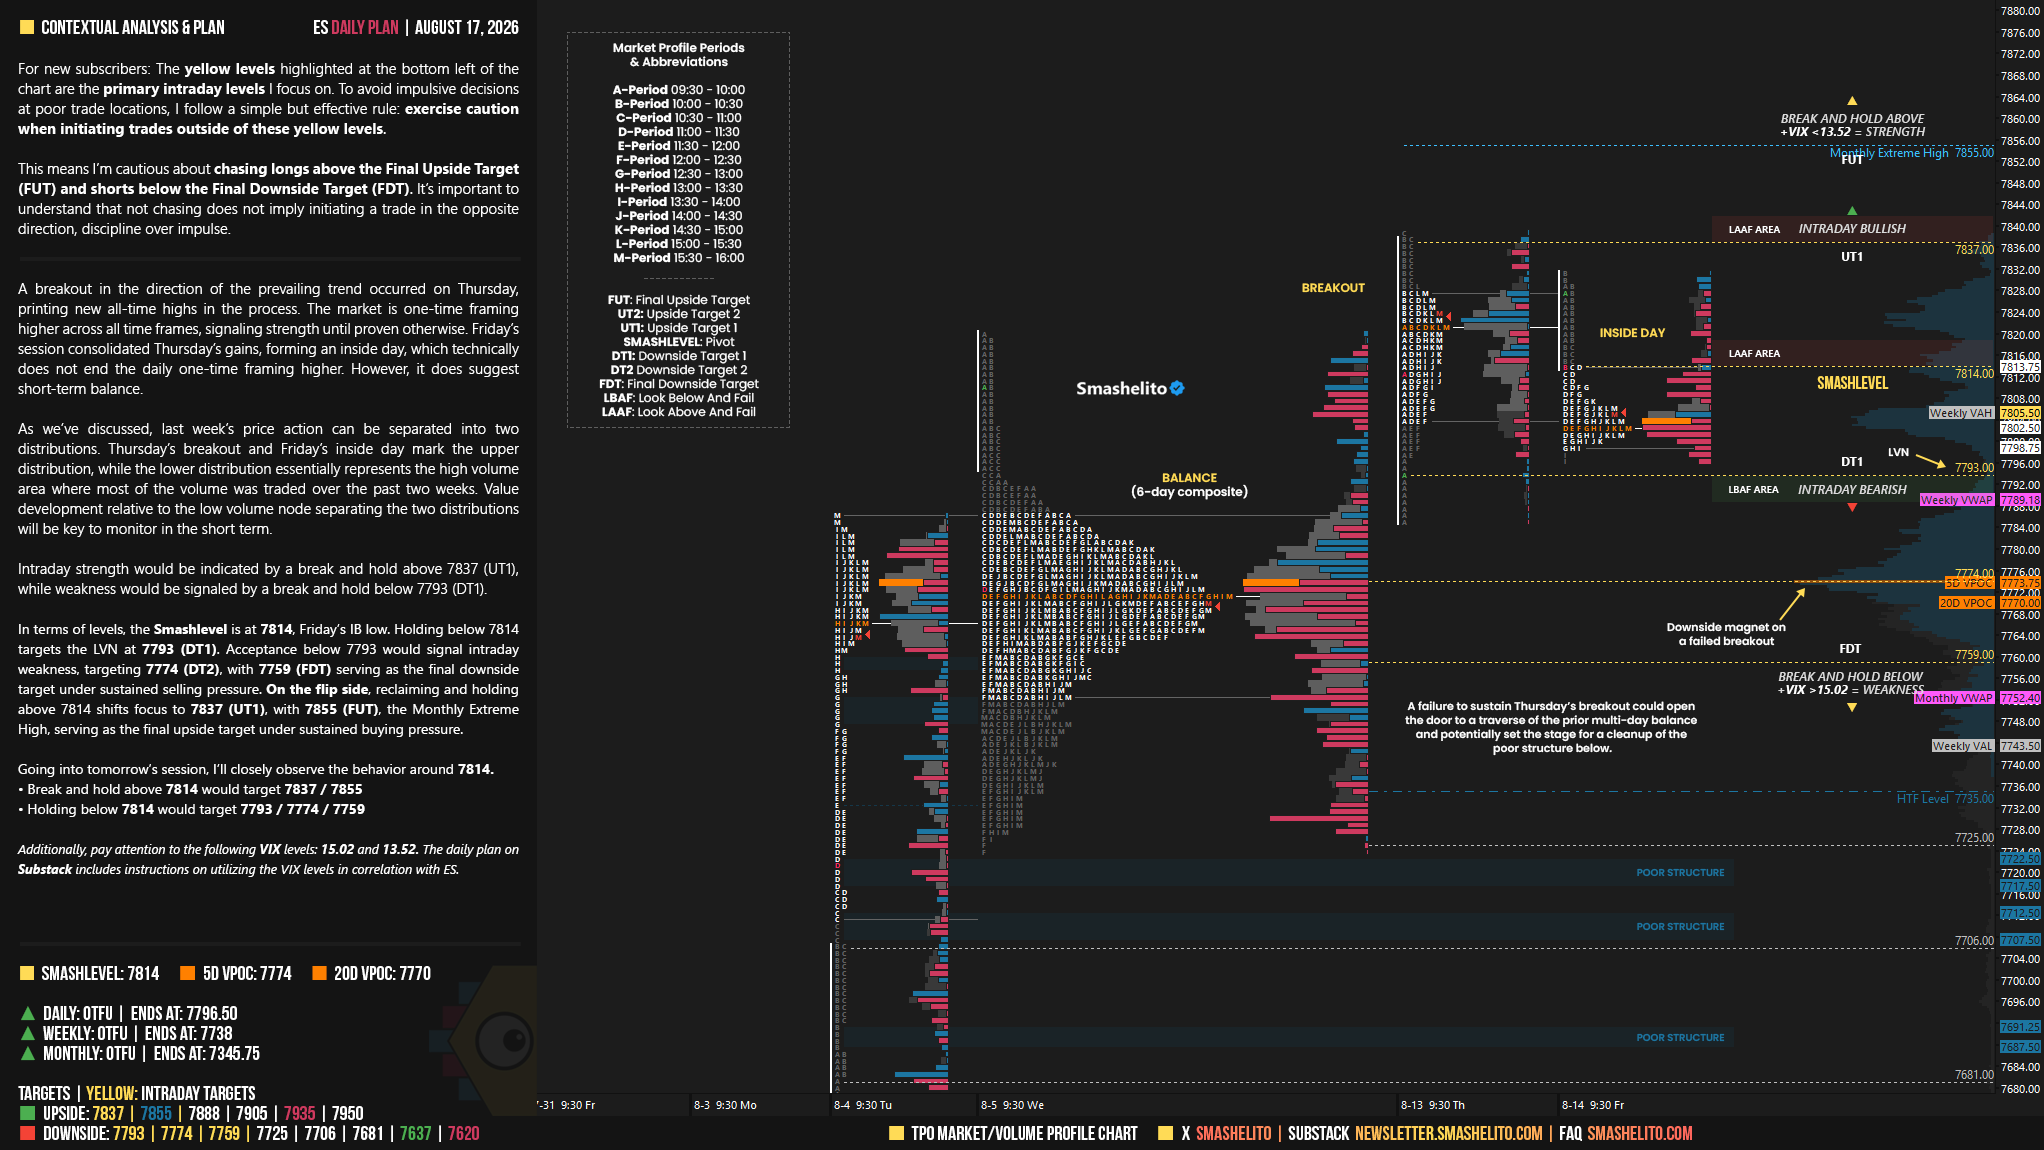
Levels of Interest
Going into tomorrow’s session, I’ll closely observe the behavior around 7814.
Break and hold above 7814 would target 7837 / 7855
Holding below 7814 would target 7793 / 7774 / 7759
Additionally, pay attention to the following VIX levels: 15.02 and 13.52. These levels can provide confirmation of strength or weakness.
Break and hold above 7855 with VIX below 13.52 would confirm strength.
Break and hold below 7759 with VIX above 15.02 would confirm weakness.
Overall, it's important to exercise caution when trading outside of the highlighted yellow levels. A non-cooperative VIX may suggest possible reversals i.e trade setups.
Thanks Smash!
Thanks Smash!