

— For new subscribers
The yellow levels highlighted at the bottom left of the chart are the primary intraday levels I focus on. To avoid impulsive decisions at poor trade locations, I follow a simple but effective rule: exercise caution when initiating trades outside of these yellow levels.
This means I’m cautious about chasing longs above the Final Upside Target (FUT) and shorts below the Final Downside Target (FDT). It’s important to understand that not chasing does not imply initiating a trade in the opposite direction. Discipline over impulse.
Be sure to review the Weekly Plan for a broader perspective, key levels, and market expectations for the week ahead.

Contextual Analysis & Plan
Last week, we discussed how trading conditions could be tricky after Monday’s and Tuesday’s notably one-sided auctions. The main reason was that the market had moved too much, too fast, at one point trading 300 handles above both the 5D and 20D VPOCs. For context, Wednesday’s high came within 35 handles of the Monthly Extreme High, despite it being only the third trading day of the month. That said, the subsequent auction behavior, with the market essentially going nowhere, is not too surprising.
The key takeaway is that buyers are doing exactly what they are supposed to do after a directional move: building value and accepting higher prices, while shifting both the 5D and 20D VPOCs higher into the current short-term balance. This doesn’t automatically mean that the balance will resolve with a break to the upside, but that remains the expected behavior. The market has now formed a 6-day balance, and sellers are yet to clean up the poor structure from last Tuesday, suggesting a clear lack of meaningful selling pressure. Reminder: even if the poor structure were to be cleaned up, sellers would still need to negate the breakout by gaining acceptance back into the prior multi-week balance area to meaningfully shift the tone. Personally, I would actually prefer to see a liquidation break that cleans up the structural deficiencies below, traps sellers at poor locations, and attracts stronger buyers at better locations for a continuation higher.
Session Recap
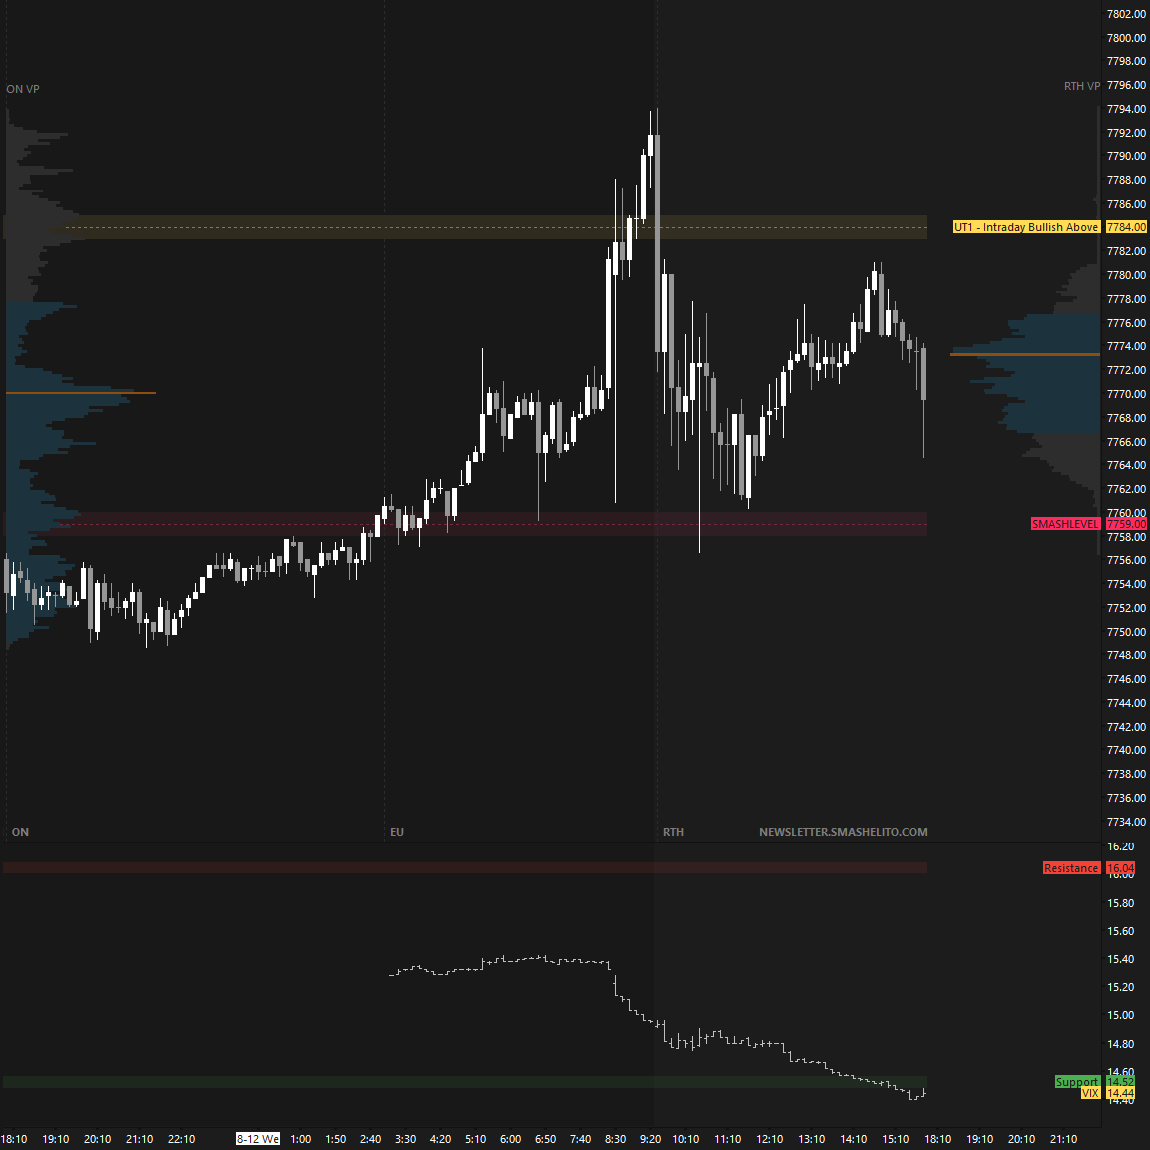
The auction remains balanced following today’s muted reaction to the CPI data, with the market now forming a 6-day balance.
Our key pivot for the week at 7784 continues to attract responsive sellers (see Figure 1); however, the lack of interest in cleaning up last week’s poor structure suggests that there are still no signs of stronger sellers (bullish consolidation). PPI is on deck tomorrow.
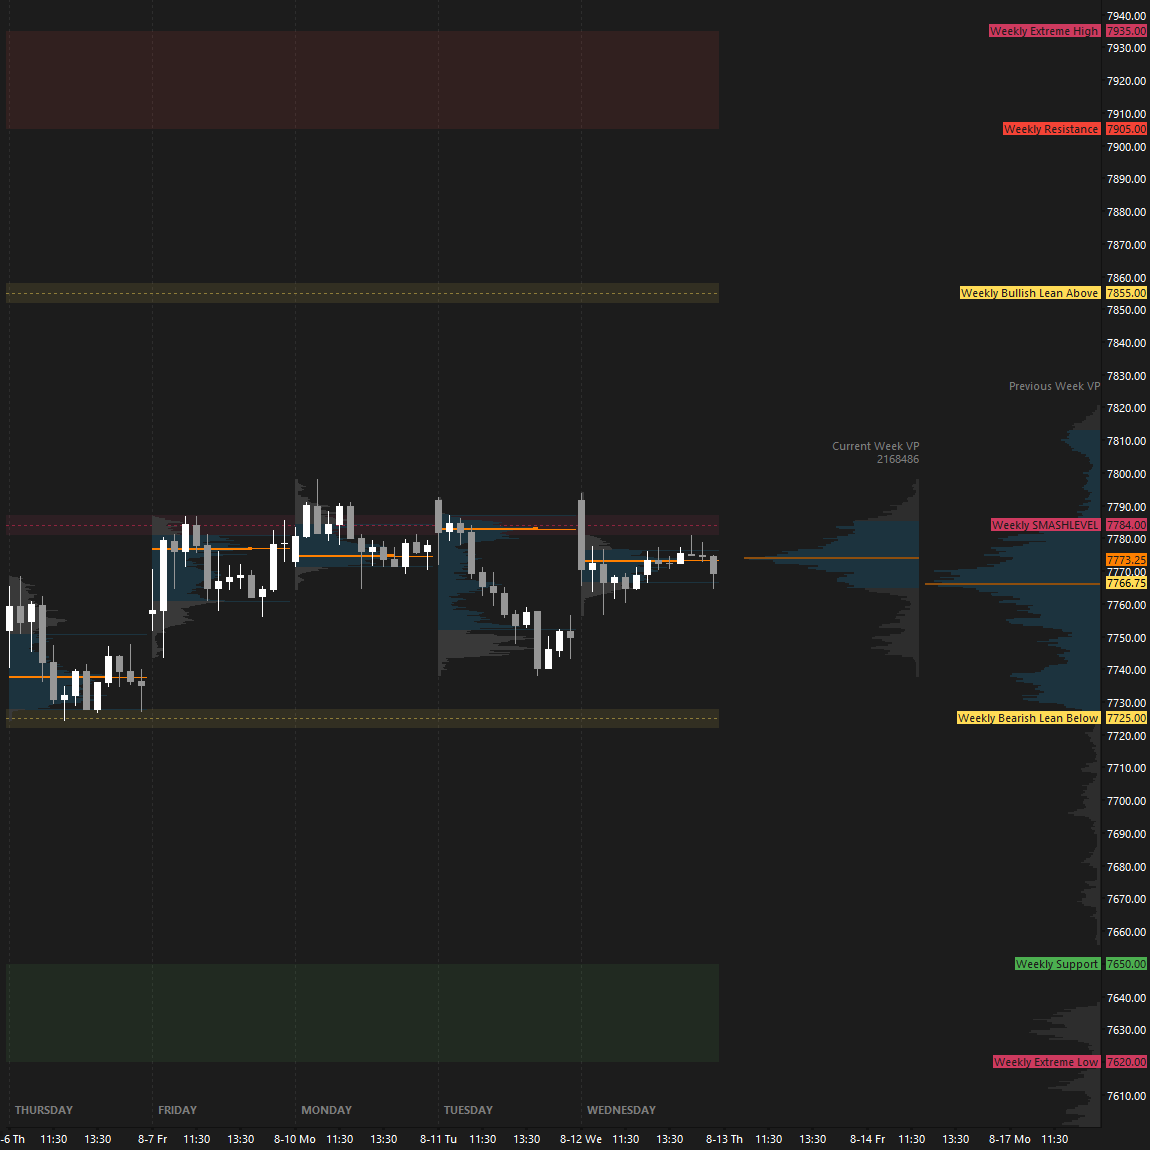
Intraday strength would be indicated by a break and hold above 7784 (UT1), while weakness would be signaled by a break and hold below 7725 (DT1).
In terms of levels, the Smashlevel is at 7759, the upper end of Tuesday’s main distribution. Holding above 7759 targets 7784 (UT1). Acceptance above 7784 would signal intraday strength, targeting 7810 (UT2), with 7836 (FUT) serving as the final upside target under sustained buying pressure.
On the flip side, failure to hold 7759 shifts focus to 7725 (DT1), with 7706 (FDT) serving as the final downside target under sustained selling pressure.
Visual Representation
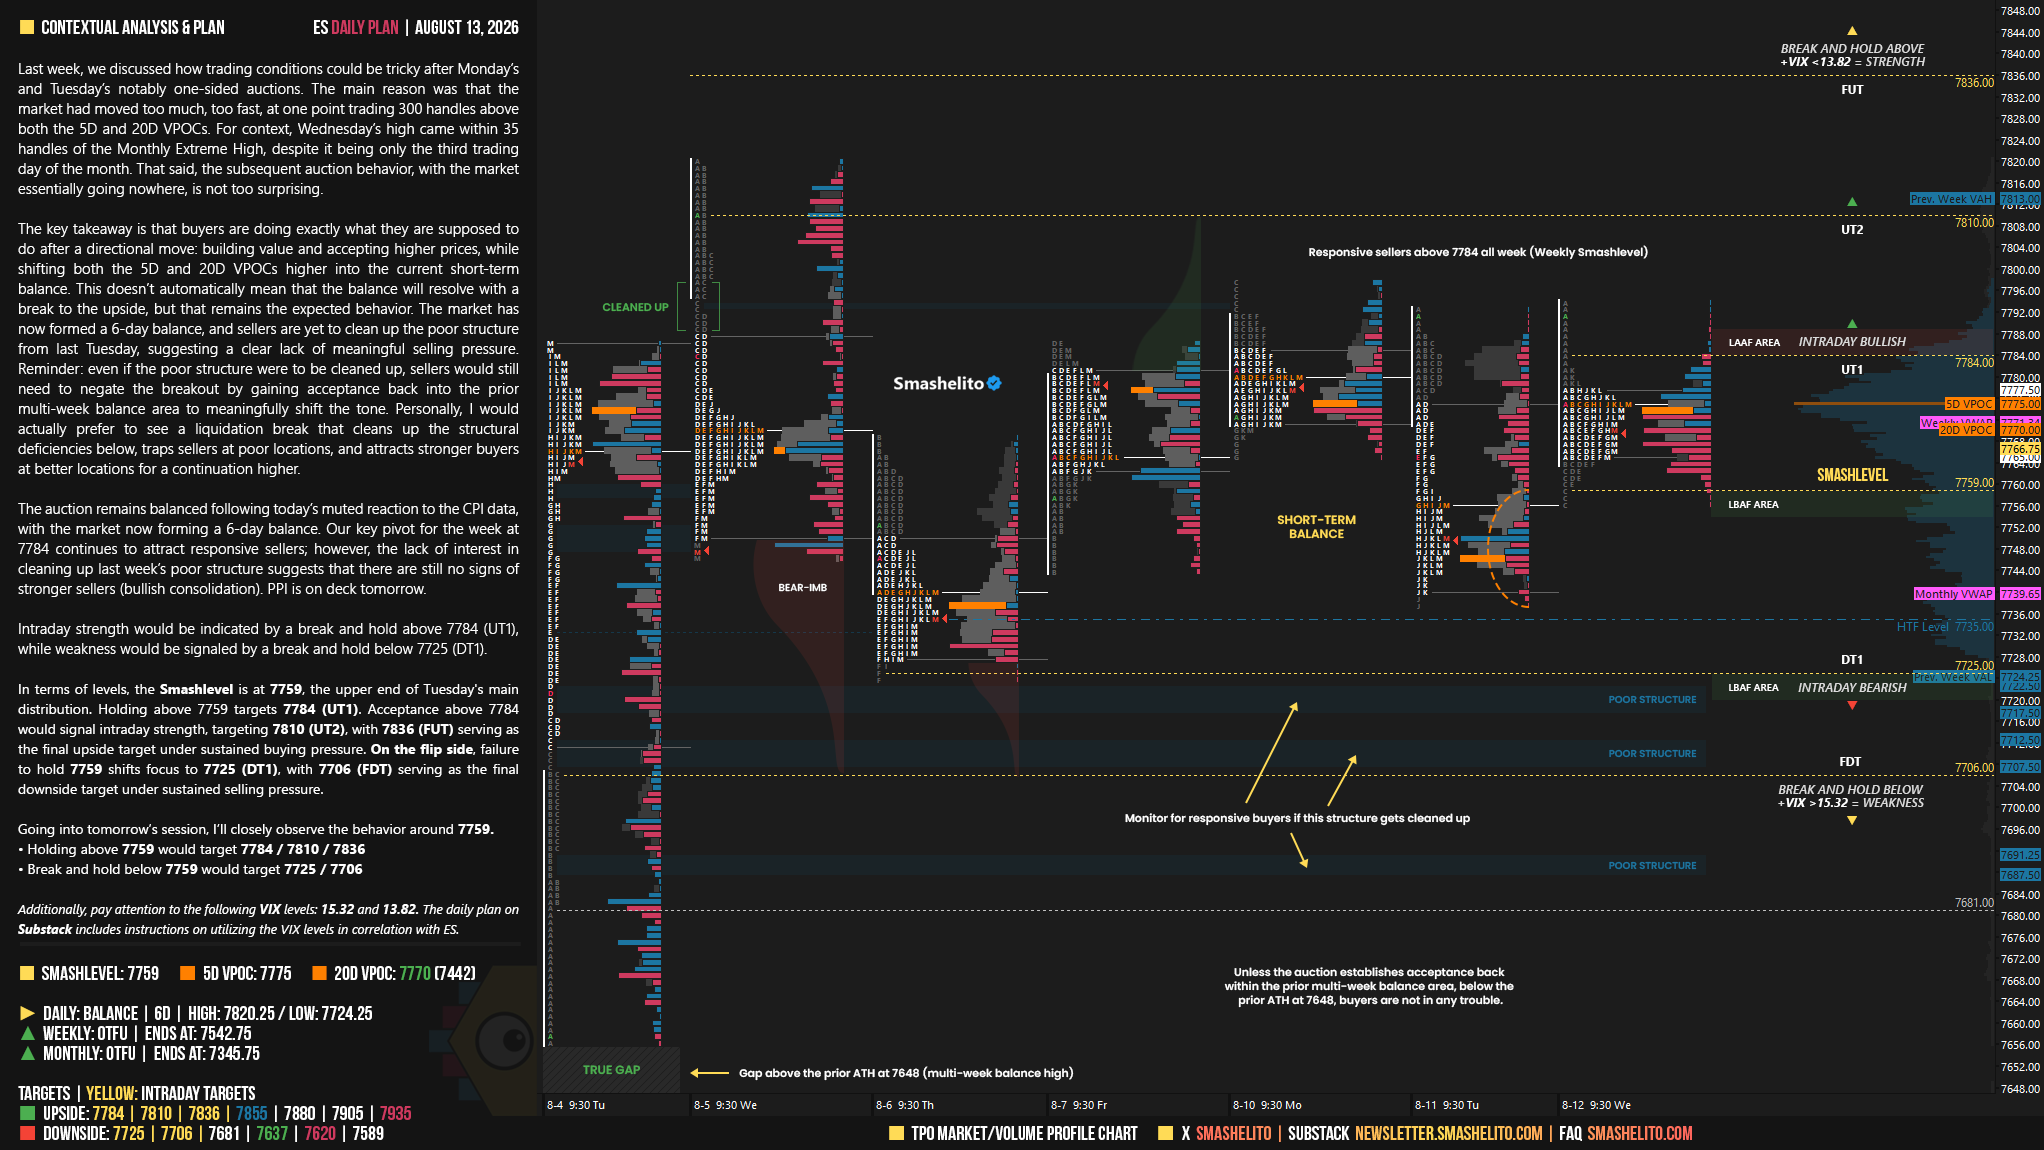
Levels of Interest
Going into tomorrow’s session, I’ll closely observe the behavior around 7759.
Holding above 7759 would target 7784 / 7810 / 7836
Break and hold below 7759 would target 7725 / 7706
Additionally, pay attention to the following VIX levels: 15.32 and 13.82. These levels can provide confirmation of strength or weakness.
Break and hold above 7836 with VIX below 13.82 would confirm strength.
Break and hold below 7706 with VIX above 15.32 would confirm weakness.
Overall, it's important to exercise caution when trading outside of the highlighted yellow levels. A non-cooperative VIX may suggest possible reversals i.e trade setups.
Thank you Smash, great context as usual.
As always, it's a pleasure to read you, thank you for everything, have a great session, it's been a slow week for me.