

— For new subscribers
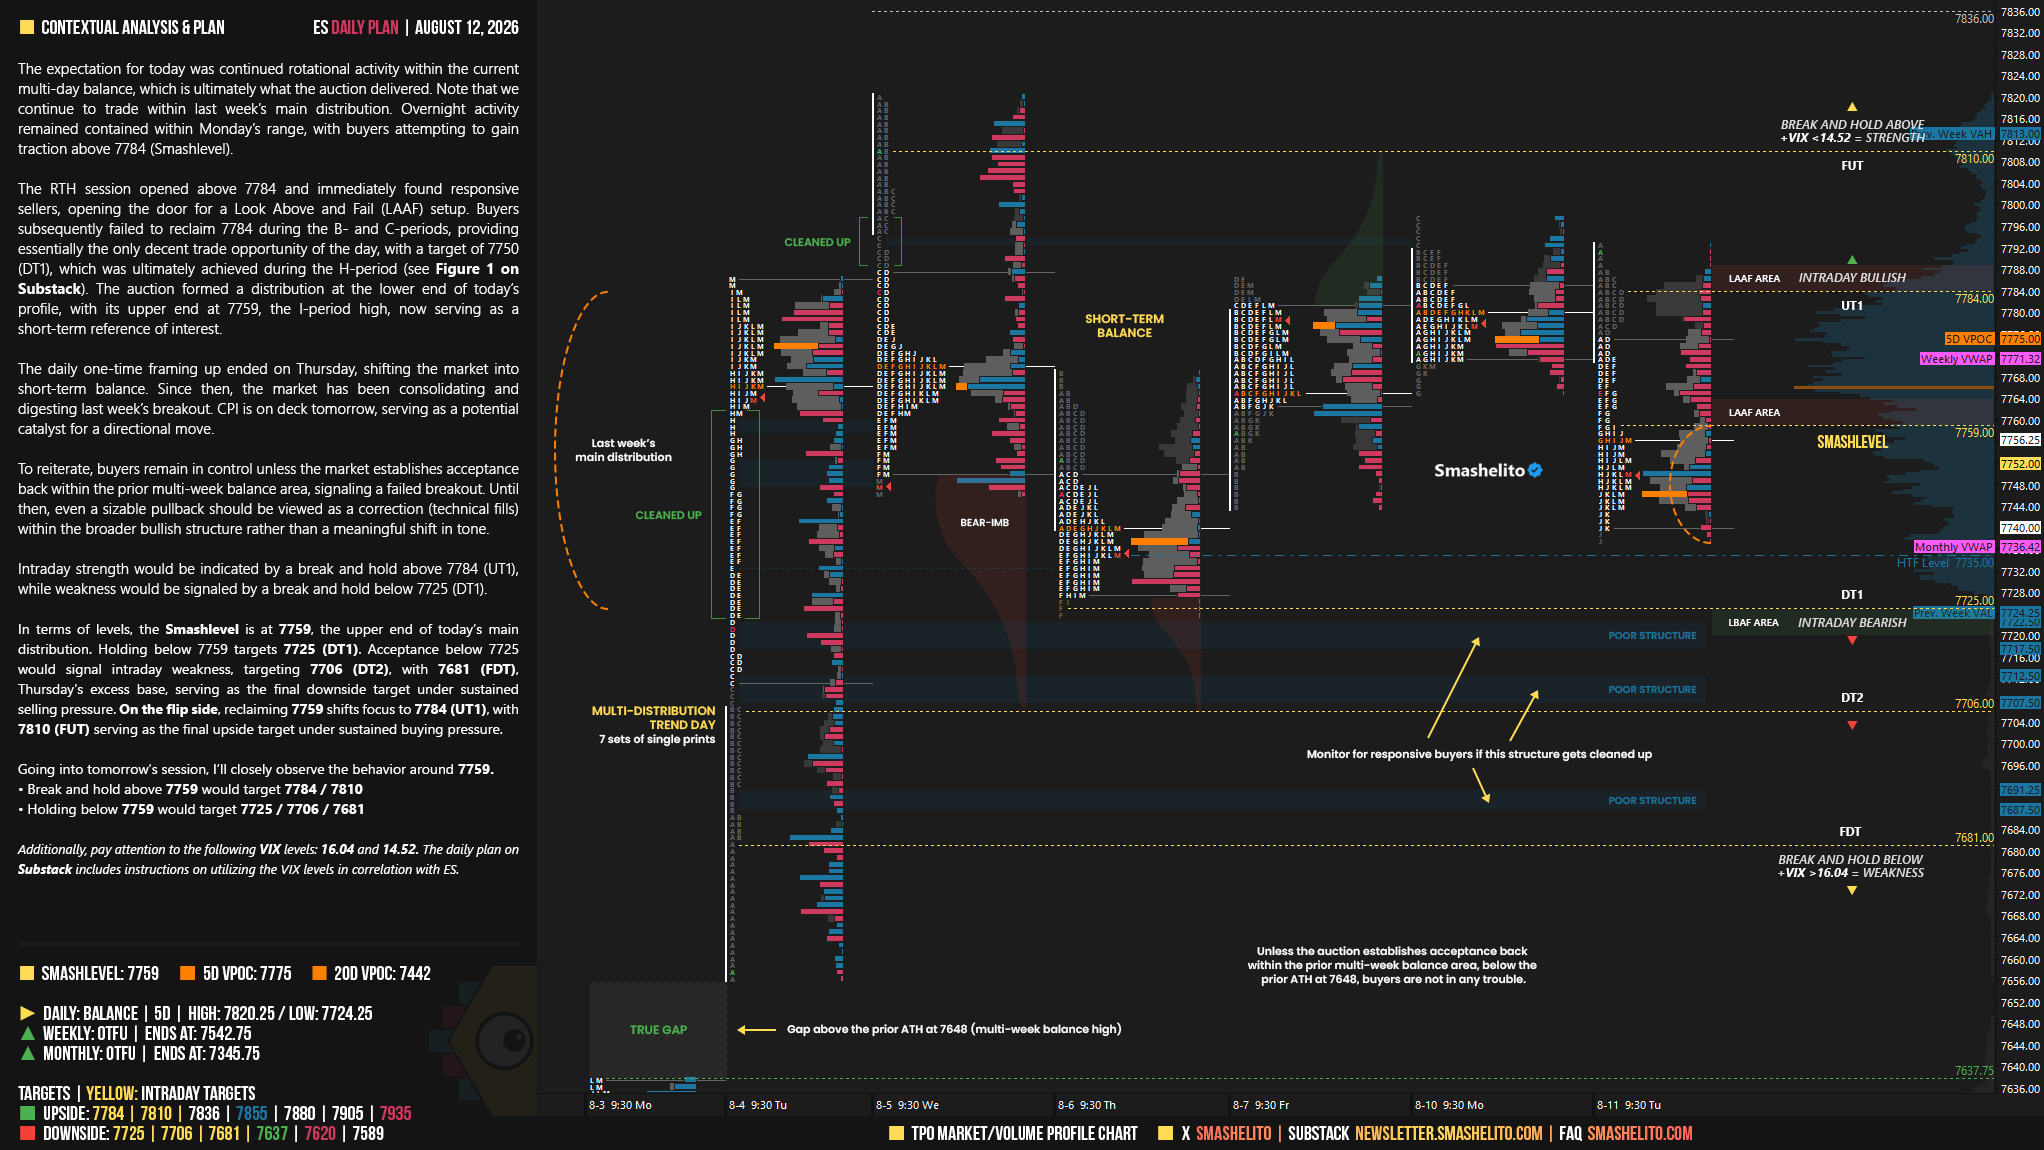
The yellow levels highlighted at the bottom left of the chart are the primary intraday levels I focus on. To avoid impulsive decisions at poor trade locations, I follow a simple but effective rule: exercise caution when initiating trades outside of these yellow levels.
This means I’m cautious about chasing longs above the Final Upside Target (FUT) and shorts below the Final Downside Target (FDT). It’s important to understand that not chasing does not imply initiating a trade in the opposite direction. Discipline over impulse.
Be sure to review the Weekly Plan for a broader perspective, key levels, and market expectations for the week ahead.

Contextual Analysis & Plan
The expectation for today was continued rotational activity within the current multi-day balance, which is ultimately what the auction delivered. Note that we continue to trade within last week’s main distribution. Overnight activity remained contained within Monday’s range, with buyers attempting to gain traction above 7784 (Smashlevel).
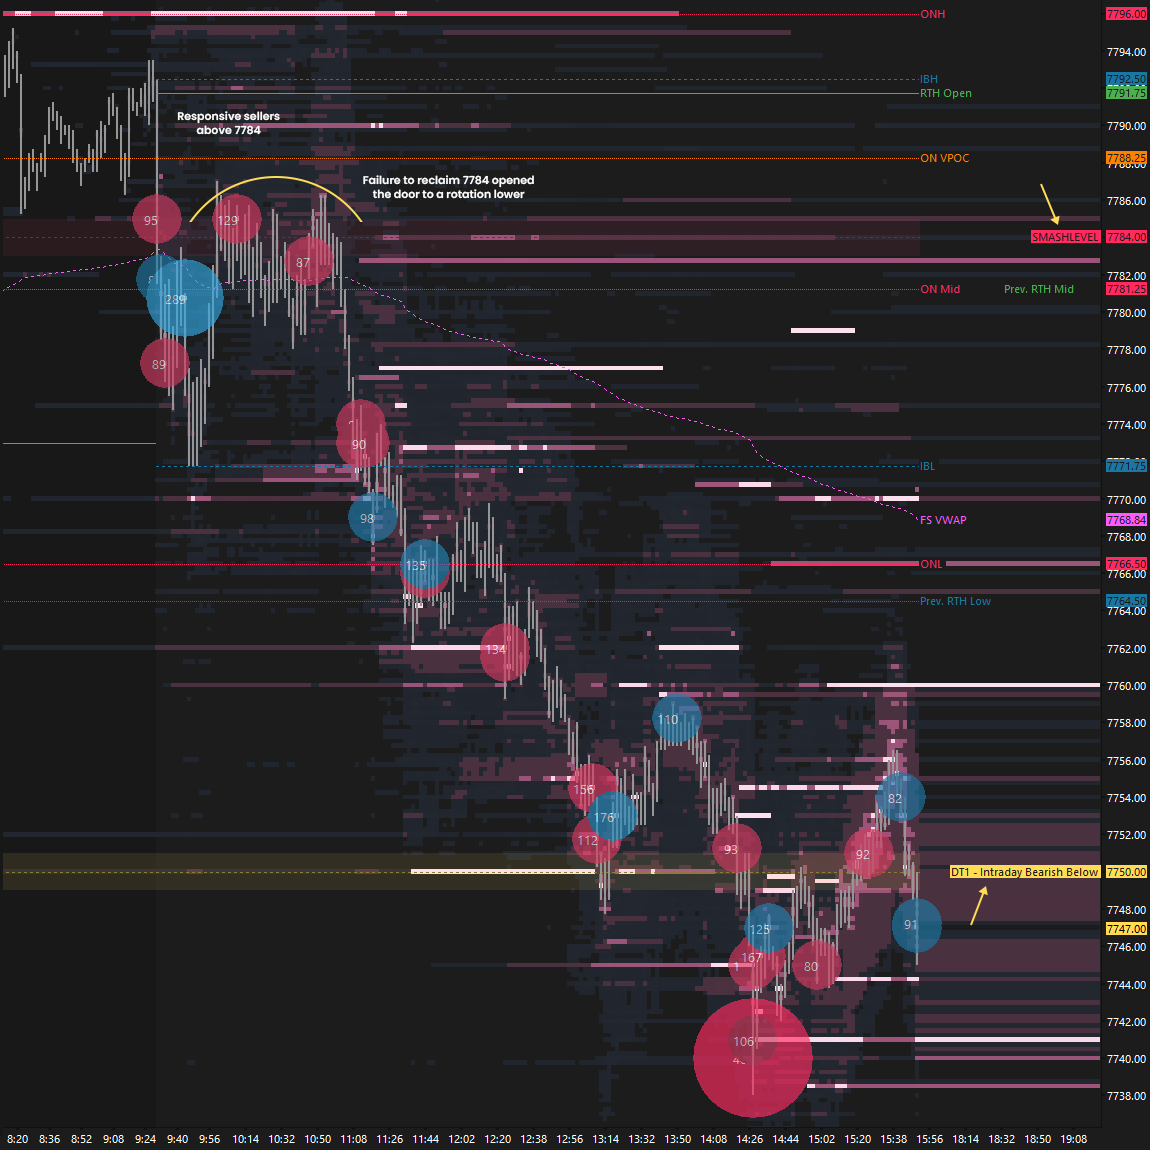
The RTH session opened above 7784 and immediately found responsive sellers, opening the door for a Look Above and Fail (LAAF) setup. Buyers subsequently failed to reclaim 7784 during the B- and C-periods, providing essentially the only decent trade opportunity of the day, with a target of 7750 (DT1), which was ultimately achieved during the H-period (see Figure 1). The auction formed a distribution at the lower end of today’s profile, with its upper end at 7759, the I-period high, now serving as a short-term reference of interest.
Session Recap
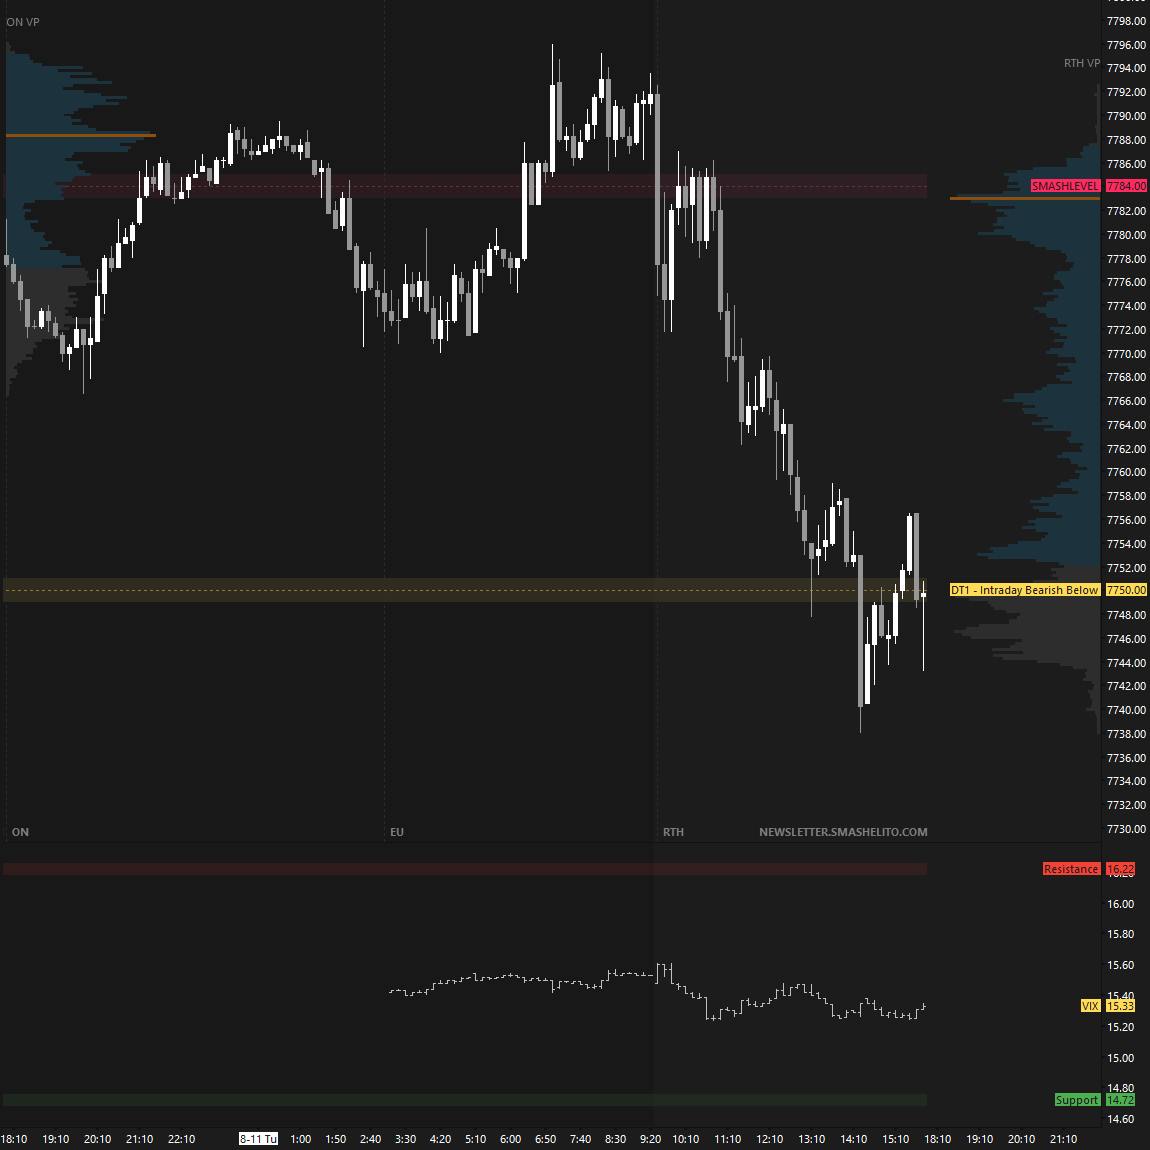
The daily one-time framing up ended on Thursday, shifting the market into short-term balance. Since then, the market has been consolidating and digesting last week’s breakout. CPI is on deck tomorrow, serving as a potential catalyst for a directional move.
To reiterate, buyers remain in control unless the market establishes acceptance back within the prior multi-week balance area, signaling a failed breakout. Until then, even a sizable pullback should be viewed as a correction (technical fills) within the broader bullish structure rather than a meaningful shift in tone.
Intraday strength would be indicated by a break and hold above 7784 (UT1), while weakness would be signaled by a break and hold below 7725 (DT1).
In terms of levels, the Smashlevel is at 7759, the upper end of today’s main distribution. Holding below 7759 targets 7725 (DT1). Acceptance below 7725 would signal intraday weakness, targeting 7706 (DT2), with 7681 (FDT), Thursday’s excess base, serving as the final downside target under sustained selling pressure.
On the flip side, reclaiming 7759 shifts focus to 7784 (UT1), with 7810 (FUT) serving as the final upside target under sustained buying pressure.
Visual Representation
Levels of Interest
Going into tomorrow’s session, I’ll closely observe the behavior around 7759.
Break and hold above 7759 would target 7784 / 7810
Holding below 7759 would target 7725 / 7706 / 7681
Additionally, pay attention to the following VIX levels: 16.04 and 14.52. These levels can provide confirmation of strength or weakness.
Break and hold above 7810 with VIX below 14.52 would confirm strength.
Break and hold below 7681 with VIX above 16.04 would confirm weakness.
Overall, it's important to exercise caution when trading outside of the highlighted yellow levels. A non-cooperative VIX may suggest possible reversals i.e trade setups.
Thanks smash !
Thanks Smash, Have a GREAT SESSION!