

— For new subscribers
The yellow levels highlighted at the bottom left of the chart are the primary intraday levels I focus on. To avoid impulsive decisions at poor trade locations, I follow a simple but effective rule: exercise caution when initiating trades outside of these yellow levels.
This means I’m cautious about chasing longs above the Final Upside Target (FUT) and shorts below the Final Downside Target (FDT). It’s important to understand that not chasing does not imply initiating a trade in the opposite direction. Discipline over impulse.
Be sure to review the Weekly Plan for a broader perspective, key levels, and market expectations for the week ahead.

Contextual Analysis & Plan
There’s not much to add after today’s rather quiet session from a contextual standpoint. Overnight, the market explored prices above 7784 (Smashlevel) and Friday’s high, ultimately resulting in a Look Above and Fail (LAAF) as the auction rotated back within Friday’s range ahead of RTH.
The RTH session followed a similar pattern, with early strength failing to hold above Friday’s high. Wednesday’s single prints were cleaned up in the process, so that’s now out of the way. The C-period saw a failed Initial Balance extension to the upside, while the G-period failed to gain traction on an IB extension to the downside, with the failure coinciding with VIX tagging its resistance level at 15.64 (HOD: 15.72).
Session Recap
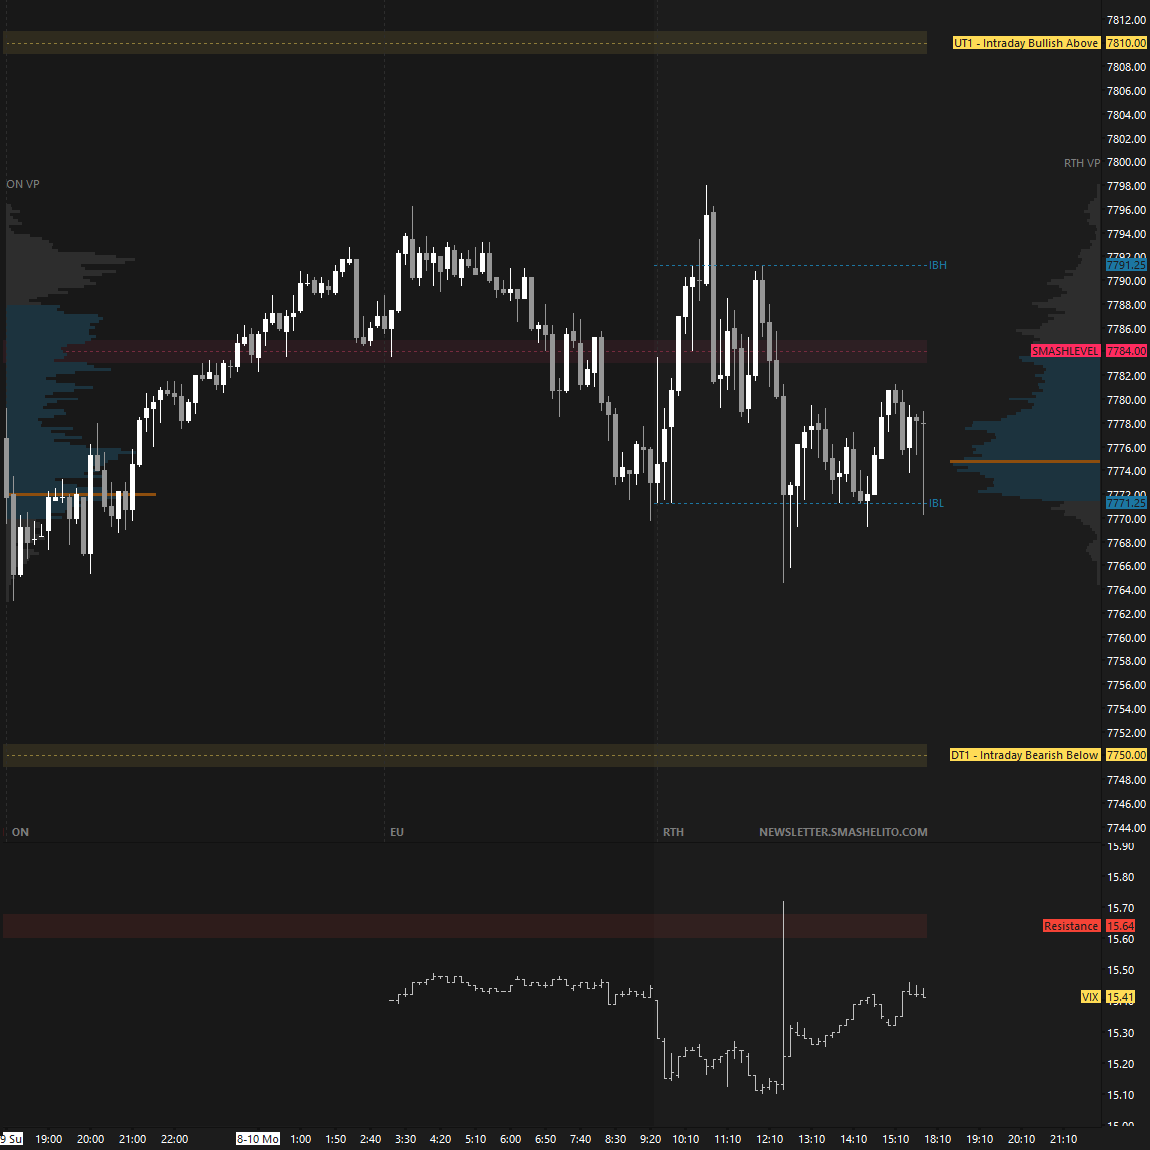
The auction remains in short-term balance as the market continues to digest last week’s significant breakout while awaiting further market-generated information.
With no data releases tomorrow, similar rotational price action can reasonably be expected, making LAAF and LBAF setups of particular interest.
Wednesday’s CPI release, however, could provide the catalyst needed to resolve this balance and set the stage for the next directional move.
“Buyers and sellers are always looking for fair prices to do business, and currently, that fair price is being established above the multi-week balance. This suggests that the consolidation remains bullish until proven otherwise, as the market continues to accept higher prices.”
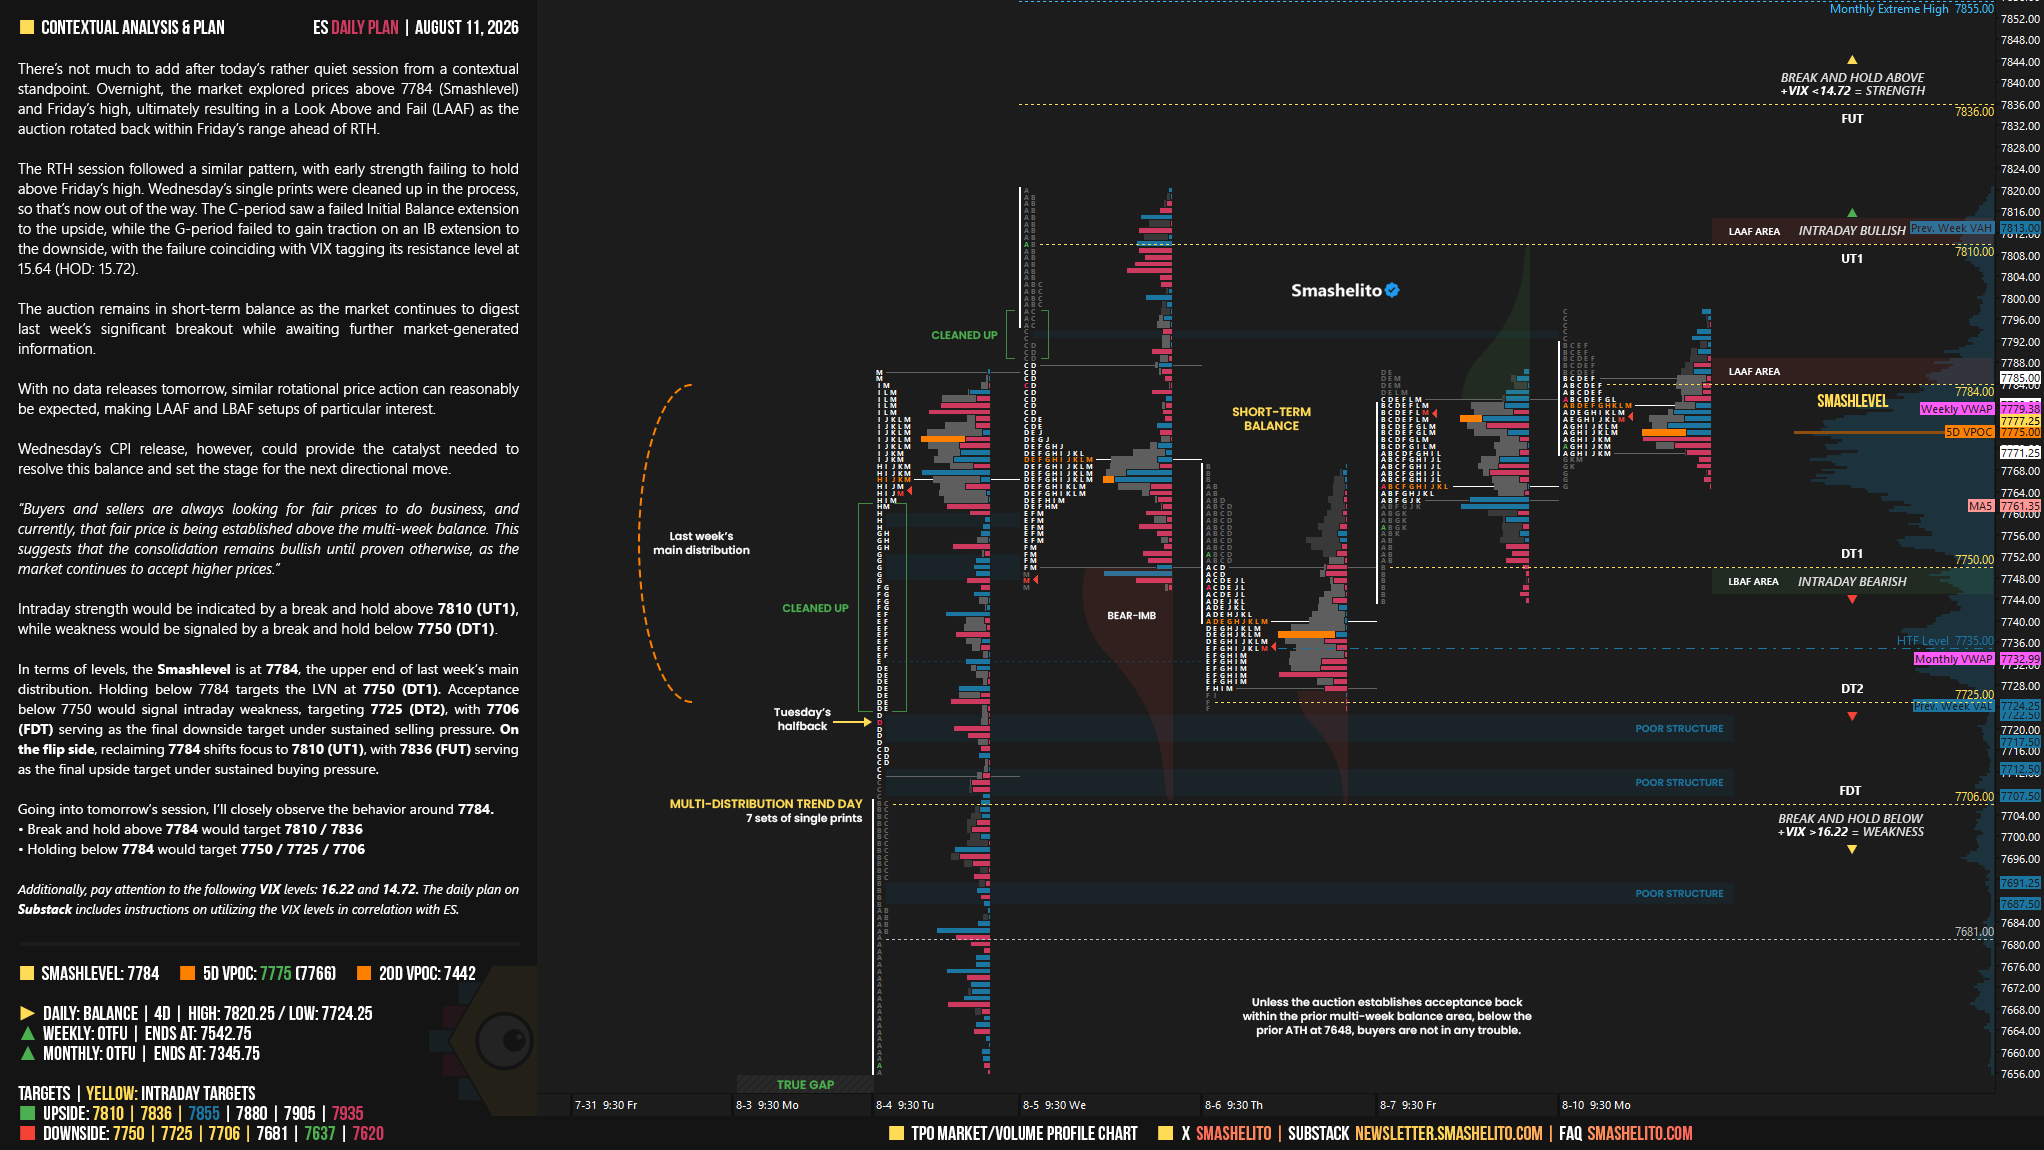
Intraday strength would be indicated by a break and hold above 7810 (UT1), while weakness would be signaled by a break and hold below 7750 (DT1).
In terms of levels, the Smashlevel is at 7784, the upper end of last week’s main distribution. Holding below 7784 targets the LVN at 7750 (DT1). Acceptance below 7750 would signal intraday weakness, targeting 7725 (DT2), with 7706 (FDT) serving as the final downside target under sustained selling pressure.
On the flip side, reclaiming 7784 shifts focus to 7810 (UT1), with 7836 (FUT) serving as the final upside target under sustained buying pressure.
Visual Representation
Levels of Interest
Going into tomorrow’s session, I’ll closely observe the behavior around 7784.
Break and hold above 7784 would target 7810 / 7836
Holding below 7784 would target 7750 / 7725 / 7706
Additionally, pay attention to the following VIX levels: 16.22 and 14.66. These levels can provide confirmation of strength or weakness.
Break and hold above 7836 with VIX below 14.66 would confirm strength.
Break and hold below 7706 with VIX above 16.22 would confirm weakness.
Overall, it's important to exercise caution when trading outside of the highlighted yellow levels. A non-cooperative VIX may suggest possible reversals i.e trade setups.
Thanks SMASH!!
Great work