ES Daily Plan | April 20, 2023
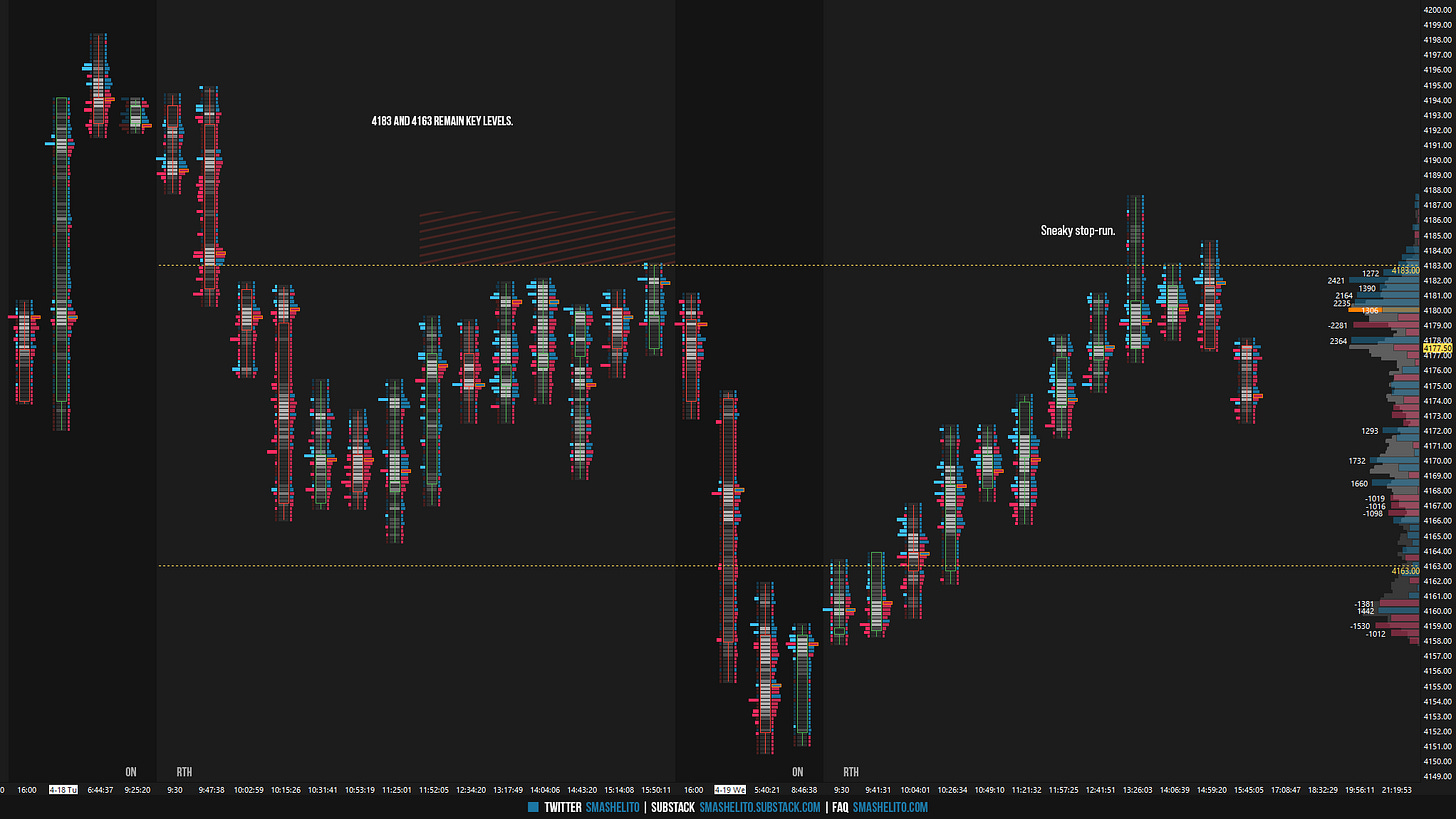
Following today's session, there isn't much to add, but the sellers were able to successfully break the daily trend of higher lows. I will continue to closely monitor the levels of 4183 and 4163.
Contextual Analysis
In the overnight (ON) session, weakness was observed as buyers were unable to regain the Smashlevel of 4183. As I mentioned in previous plan, the lack of a closing rally in the previous session indicated a shift in pattern. The primary objective of the sellers was to break the pattern of higher lows, which they achieved during the overnight weakness. Furthermore, the sellers successfully broke another level of interest at 4163, which represents the value area high of the last 14 trading days. It's worth noting that after the breach of 4163, the VIX tested its resistance level of 17.60, with the highest point reached by the VIX being 17.72. The ON low of 4150.50 also served as the low of the full session.
Today's regular opening hours (RTH) mirrored yesterday's session, but in reverse. The session opened with a true gap to the downside within the multi-day value area. Today, the sellers had a hard time gaining traction below the opening level of 4158.50 as the aggressive selling was heavily absorbed. Note the attached delta profile to the right. Opening on a true gap to the downside within the multi-day value area and putting an end to the daily one time framing down should have triggered more weakness, but it didn’t. Instead, a poor low was formed. This is an important piece of market-generated information. Just like yesterday, the gap was filled in B-period already. The market was one time framing up intraday, slowly establishing acceptance back within previous day’s range, which is the most bullish outcome when dealing with gaps to the downside. The sellers were completely negated, leading to the market testing the Smashlevel of 4183 and yesterday's excess, traversing the previous day's value area in the process. We witnessed significant absorption around the 4183 level, which highlights its crucial importance for the sellers to maintain.
After today’s session, there is not much to add. I will continue to closely monitor the levels of 4183 and 4163. We now have three consecutive daily closes within this area. Speaking of three, the sellers managed to end the daily one time framing up, which means that the daily returns to a 3-day balance. The short-term value (5-day VPOC) has shifted from 4145 to 4170. All levels remain unchanged.
Going into tomorrow's session, I will observe 4183.
Break and hold above 4183 would target 4194 / 4208 / 4220
Holding below 4183 would target 4163 / 4146 / 4130
Additionally, pay attention to the following VIX levels: 17.30 and 15.62. These levels can provide confirmation of strength or weakness.
Break and hold above 4220 with VIX below 15.62 would confirm strength.
Break and hold below 4130 with VIX above 17.30 would confirm weakness.
Overall, it's important to exercise caution when trading outside of the highlighted yellow levels. A non-cooperative VIX may suggest possible reversals i.e trade setups.
Be sure to check out the Weekly Plan, which provides a broader perspective and highlights significant levels of interest to watch in the coming week.
Disclaimer: Futures and options trading involves a high level of risk, with the potential for substantial losses. The information provided in this newsletter is for informational purposes only and is not intended to be a trade recommendation. It is the responsibility of the reader to make their own investment decisions and they should seek the advice of a qualified securities professional before making any investments. The owners/authors of this newsletter are not certified as registered financial professionals or investment advisers.


I noticed each new footprint is not based on time (ex. every 5 minutes, 15 minutes, etc). What is it based on?
Is there a precise definition of a closing rally? (=M-period rally?)