
ES Daily Plan | April 2, 2026
Market Context & Key Levels for the Day Ahead

— For new subscribers
The yellow levels highlighted at the bottom left of the chart are the primary intraday levels I focus on. To avoid impulsive decisions at poor trade locations, I follow a simple but effective rule: exercise caution when initiating trades outside of these yellow levels.
This means I’m cautious about chasing longs above the Final Upside Target (FUT) and shorts below the Final Downside Target (FDT). It’s important to understand that not chasing does not imply initiating a trade in the opposite direction, discipline over impulse.
Be sure to review the Weekly Plan for a broader perspective, key levels, and market expectations for the week ahead.

Contextual Analysis & Plan
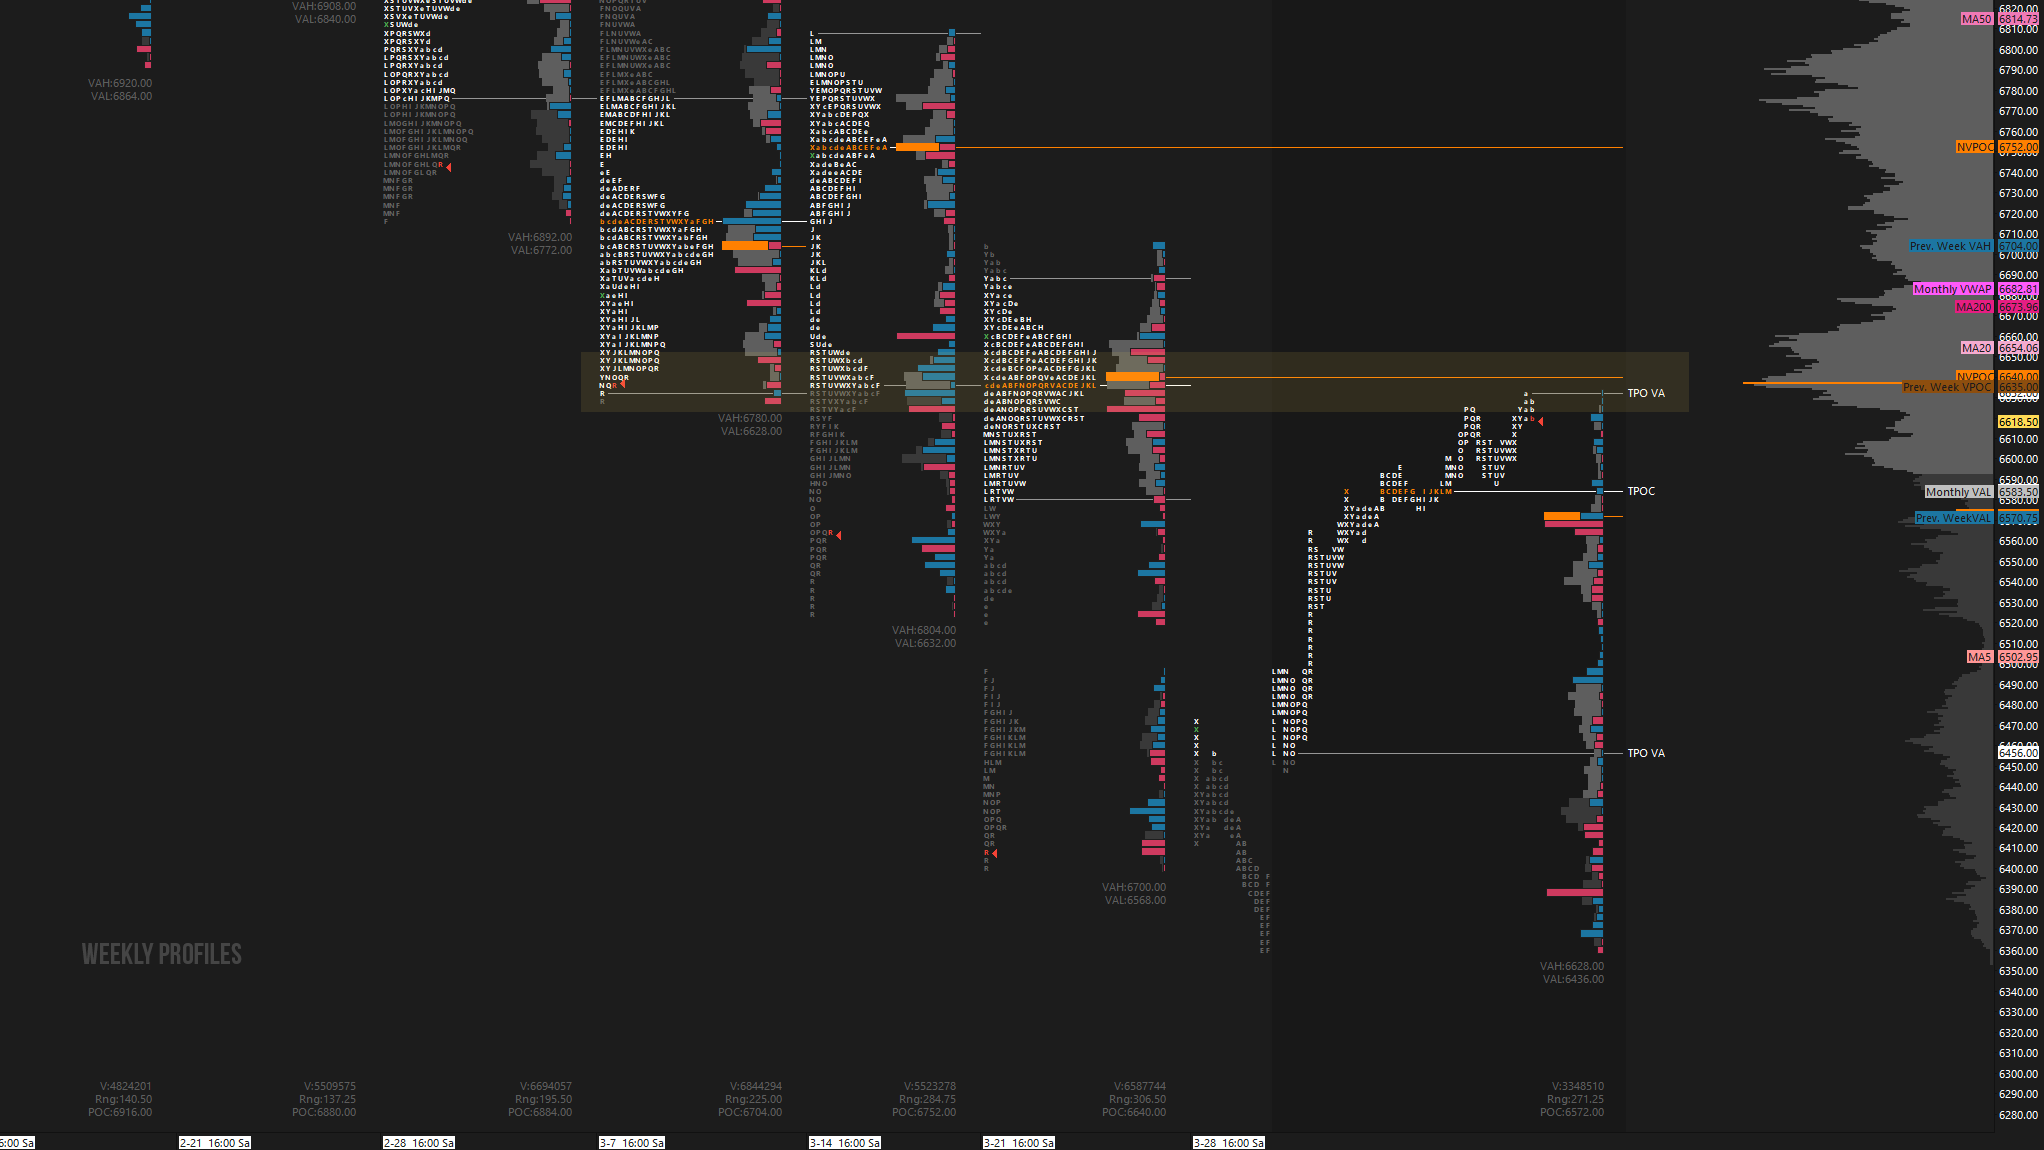
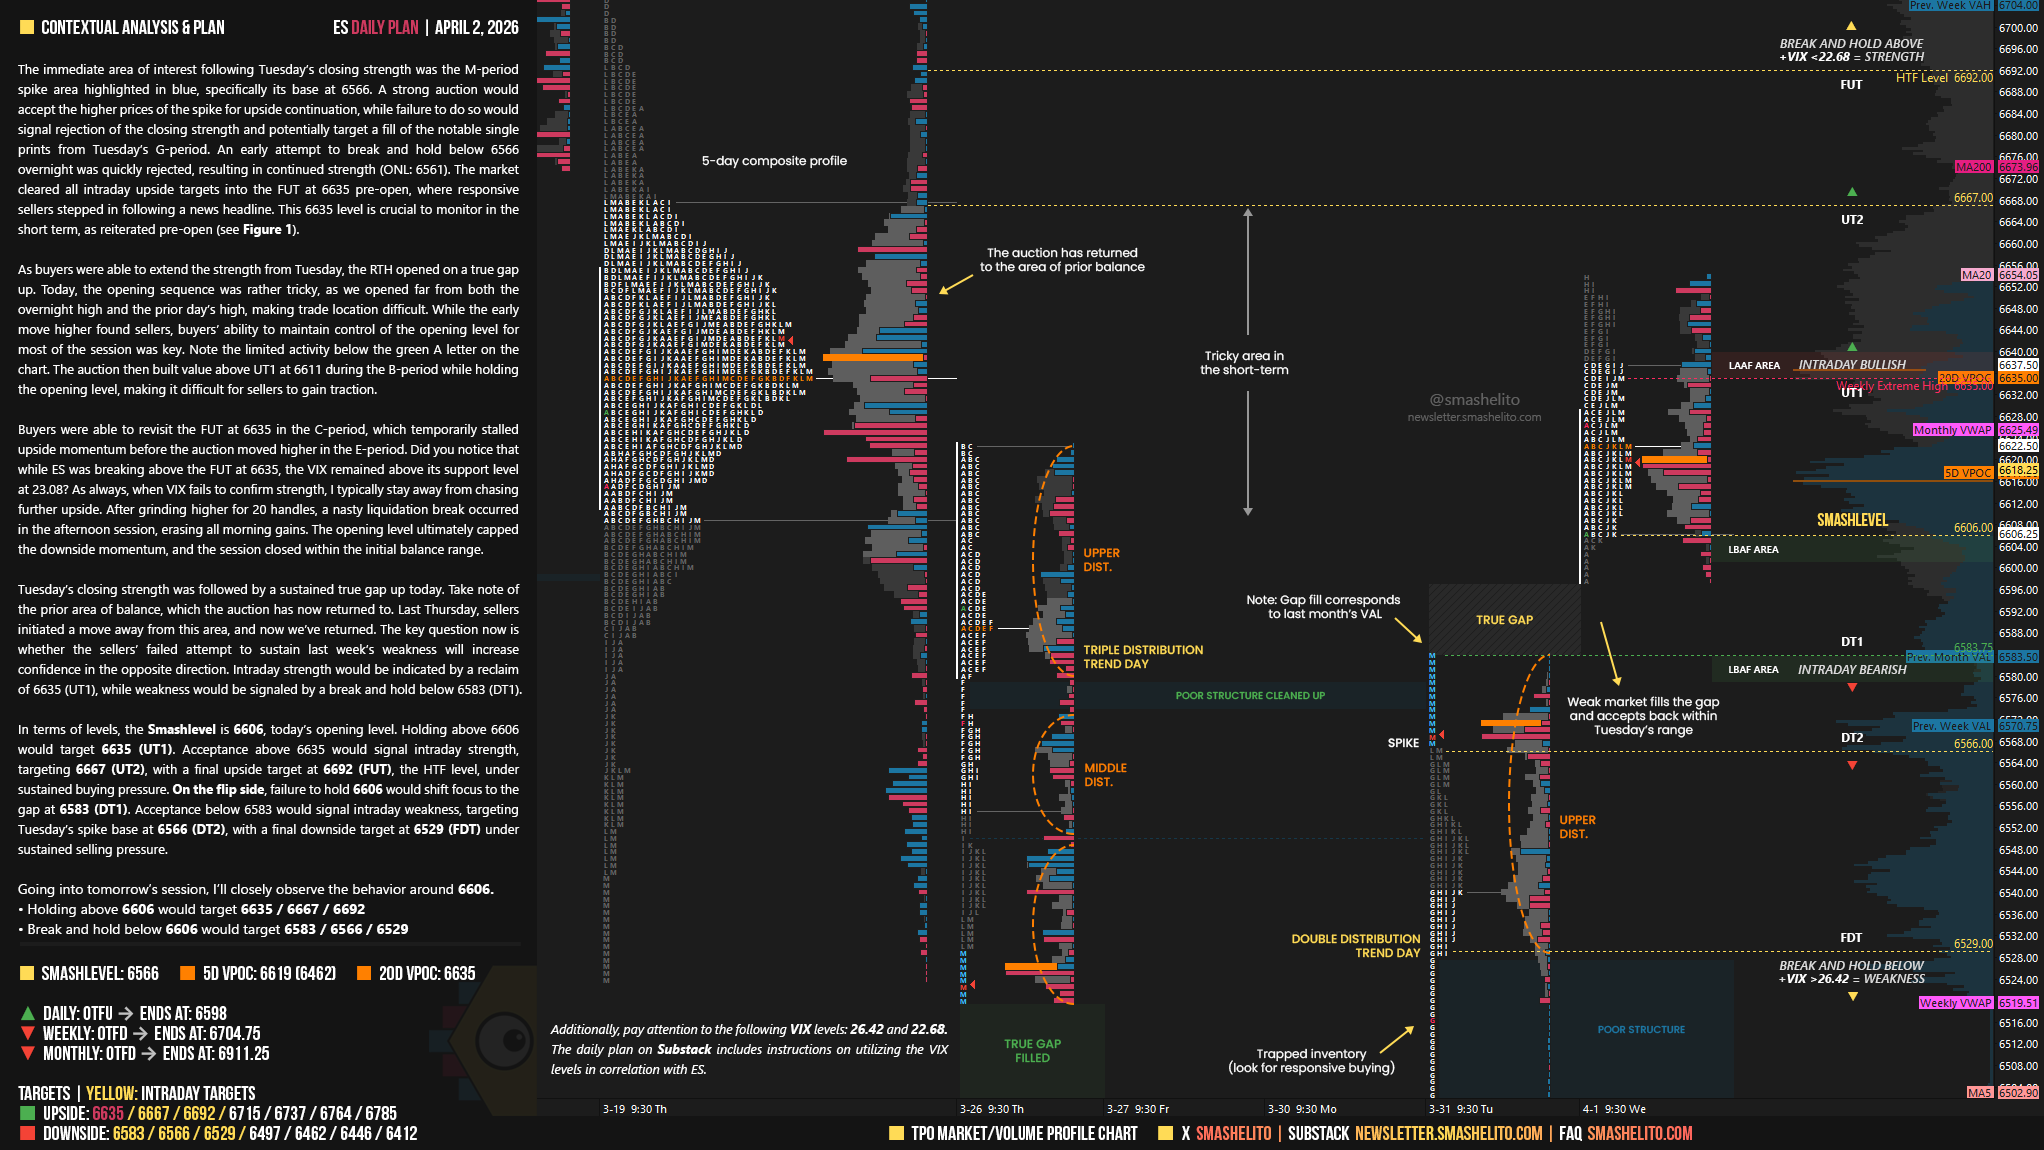
The immediate area of interest following Tuesday’s closing strength was the M-period spike area highlighted in blue, specifically its base at 6566. A strong auction would accept the higher prices of the spike for upside continuation, while failure to do so would signal rejection of the closing strength and potentially target a fill of the notable single prints from Tuesday’s G-period. An early attempt to break and hold below 6566 overnight was quickly rejected, resulting in continued strength (ONL: 6561). The market cleared all intraday upside targets into the FUT at 6635 pre-open, where responsive sellers stepped in following a news headline. This 6635 level is crucial to monitor in the short term, as reiterated pre-open (see Figure 1).
As buyers were able to extend the strength from Tuesday, the RTH opened on a true gap up. Today, the opening sequence was rather tricky, as we opened far from both the overnight high and the prior day’s high, making trade location difficult. While the early move higher found sellers, buyers’ ability to maintain control of the opening level for most of the session was key. Note the limited activity below the green A letter on the chart. The auction then built value above UT1 at 6611 during the B-period while holding the opening level, making it difficult for sellers to gain traction.
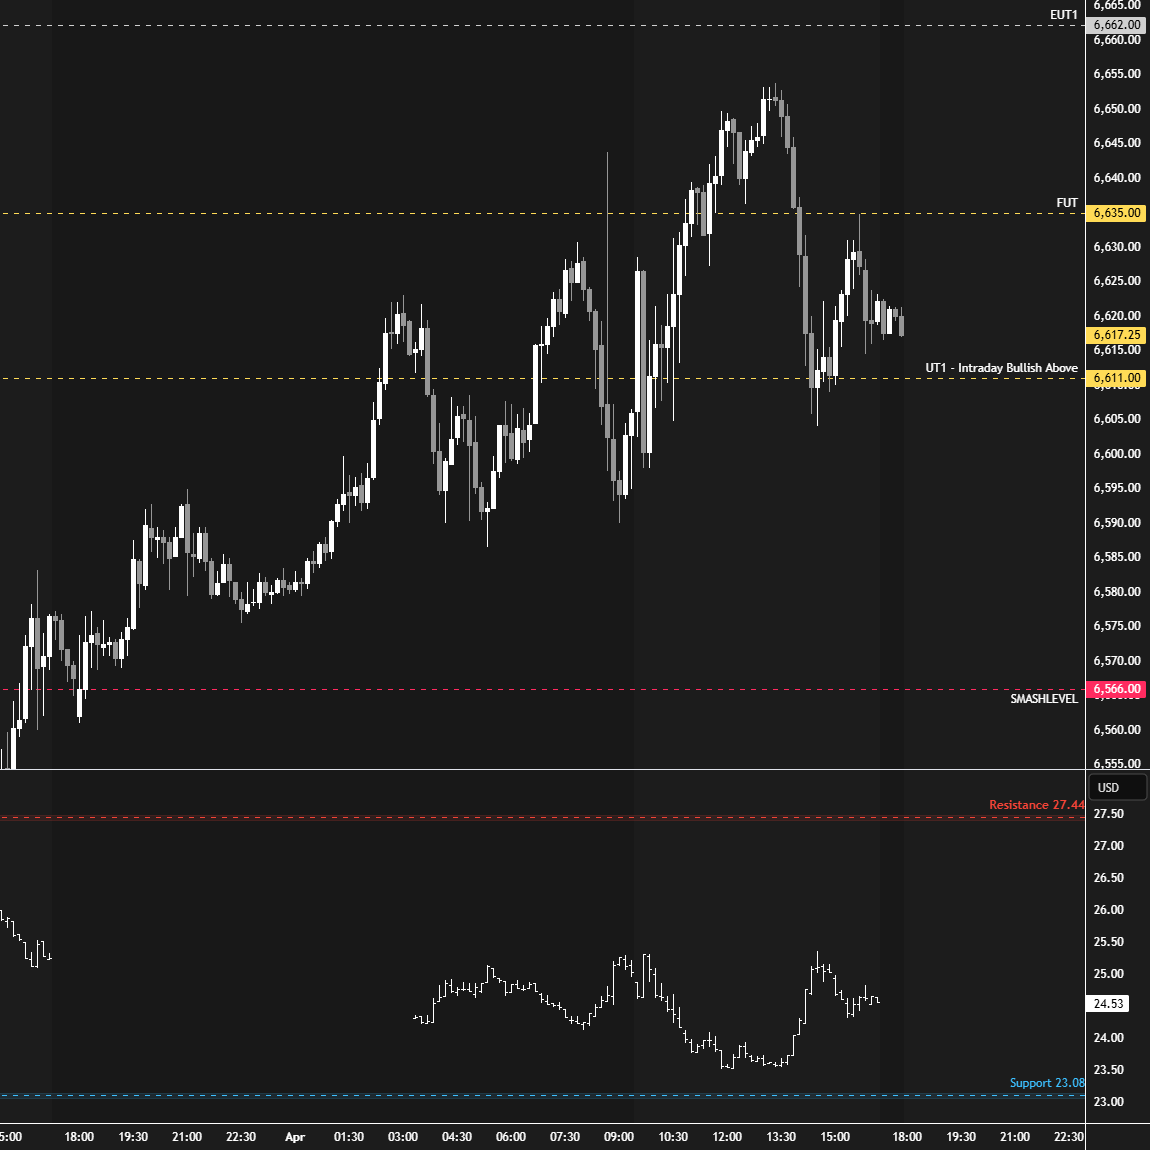
Buyers were able to revisit the FUT at 6635 in the C-period, which temporarily stalled upside momentum before the auction moved higher in the E-period. Did you notice that while ES was breaking above the FUT at 6635, the VIX remained above its support level at 23.08? As always, when VIX fails to confirm strength, I typically stay away from chasing further upside. After grinding higher for 20 handles, a nasty liquidation break occurred in the afternoon session, erasing all morning gains. The opening level ultimately capped the downside momentum, and the session closed within the initial balance range.
Tuesday’s closing strength was followed by a sustained true gap up today. Take note of the prior area of balance, which the auction has now returned to. Last Thursday, sellers initiated a move away from this area, and now we’ve returned. The key question now is whether the sellers’ failed attempt to sustain last week’s weakness will increase confidence in the opposite direction. Intraday strength would be indicated by a reclaim of 6635 (UT1), while weakness would be signaled by a break and hold below 6583 (DT1).
In terms of levels, the Smashlevel is 6606, today’s opening level. Holding above 6606 would target 6635 (UT1). Acceptance above 6635 would signal intraday strength, targeting 6667 (UT2), with a final upside target at 6692 (FUT), the HTF level, under sustained buying pressure.
On the flip side, failure to hold 6606 would shift focus to the gap at 6583 (DT1). Acceptance below 6583 would signal intraday weakness, targeting Tuesday’s spike base at 6566 (DT2), with a final downside target at 6529 (FDT) under sustained selling pressure.
Levels of Interest
Going into tomorrow’s session, I’ll closely observe the behavior around 6606.
Holding above 6606 would target 6635 / 6667 / 6692
Break and hold below 6606 would target 6583 / 6566 / 6529
Additionally, pay attention to the following VIX levels: 26.42 and 22.68. These levels can provide confirmation of strength or weakness.
Break and hold above 6692 with VIX below 22.68 would confirm strength.
Break and hold below 6529 with VIX above 26.42 would confirm weakness.
Overall, it's important to exercise caution when trading outside of the highlighted yellow levels. A non-cooperative VIX may suggest possible reversals i.e trade setups.
Very good work as always smash 💥
Caught whole nasty liquidation in afternoon. ( do not chase above weekly extremes and heaviest volume of the day at high in 16 tick range for hour and finish bar started close heavy red -400 plus above 6635)
Thanks as always, same here - caught the short