
ES Daily Plan | March 4, 2026
Market Context & Key Levels for the Day Ahead

— For new subscribers
The yellow levels highlighted at the bottom left of the chart are the primary intraday levels I focus on. To avoid impulsive decisions at poor trade locations, I follow a simple but effective rule: exercise caution when initiating trades outside of these yellow levels.
This means I’m cautious about chasing longs above the Final Upside Target (FUT) and shorts below the Final Downside Target (FDT). It’s important to understand that not chasing does not imply initiating a trade in the opposite direction — discipline over impulse.
Be sure to review the Weekly Plan for a broader perspective, key levels, and market expectations for the week ahead.

Contextual Analysis & Plan
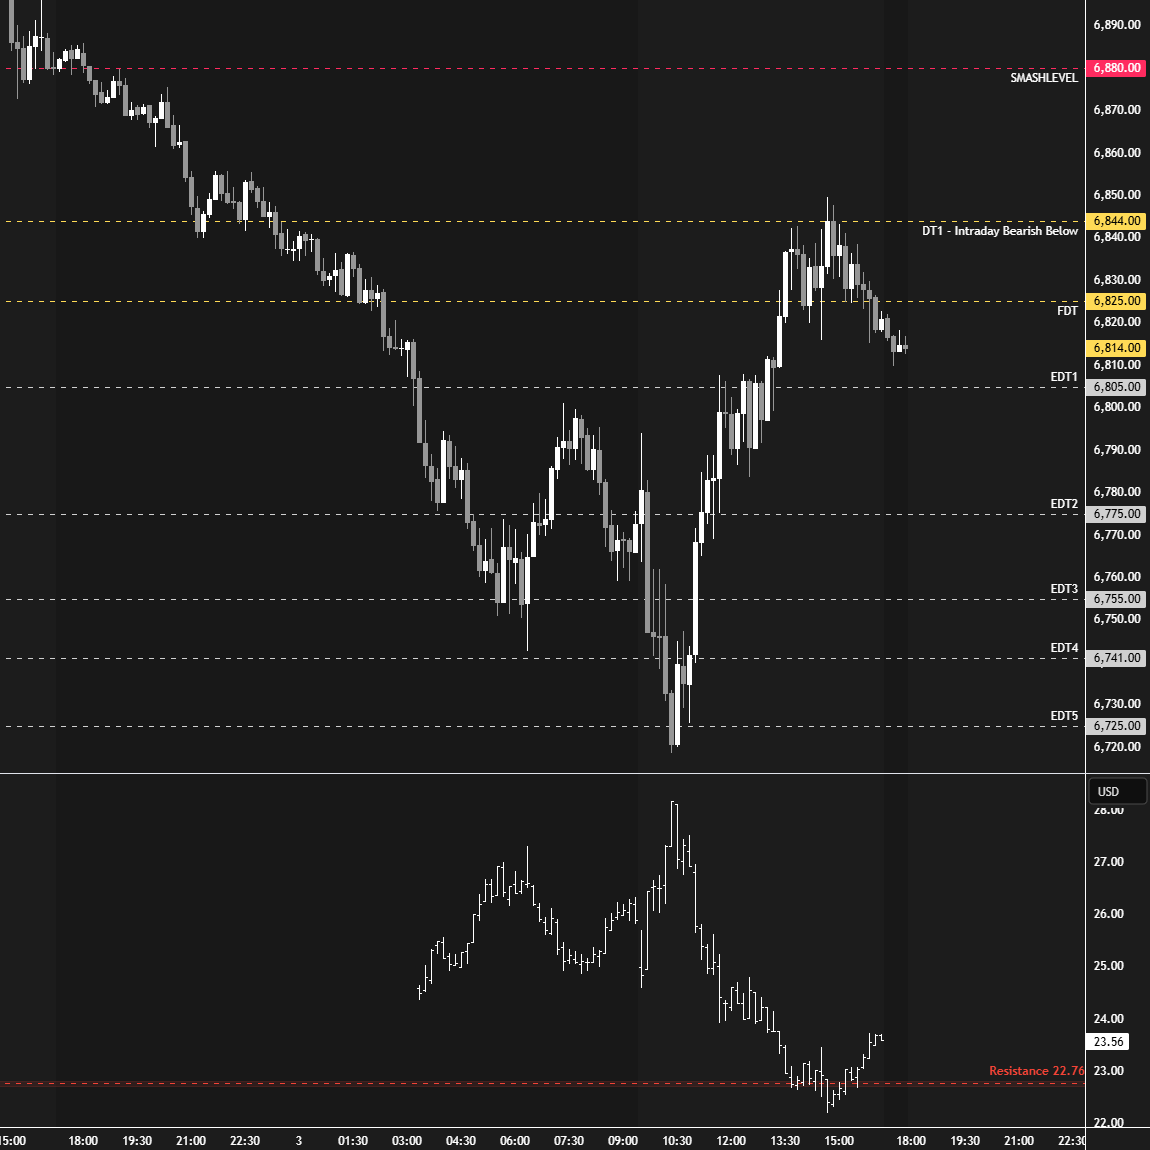
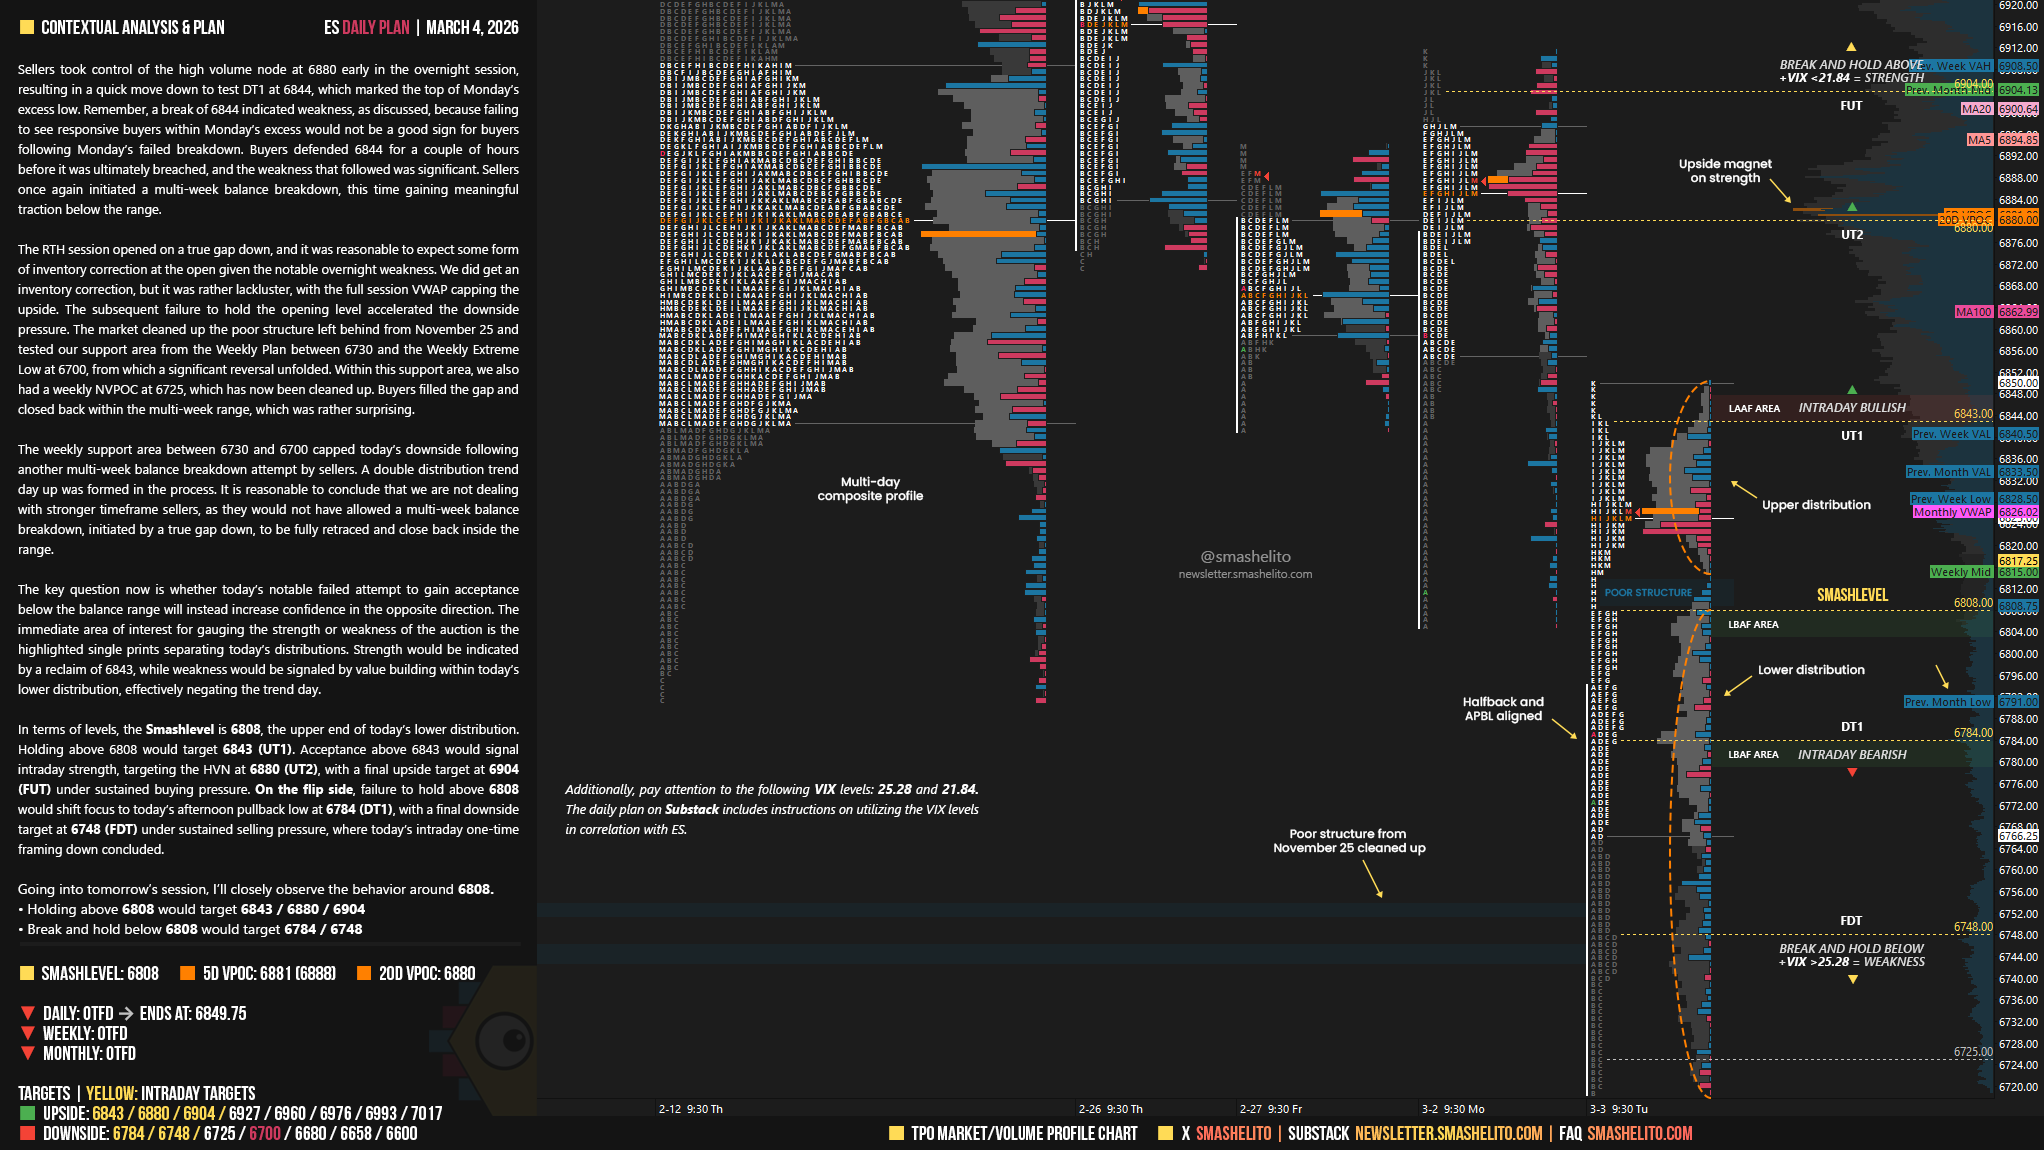
Sellers took control of the high volume node at 6880 early in the overnight session, resulting in a quick move down to test DT1 at 6844, which marked the top of Monday’s excess low. Remember, a break of 6844 indicated weakness, as discussed, because failing to see responsive buyers within Monday’s excess would not be a good sign for buyers following Monday’s failed breakdown. Buyers defended 6844 for a couple of hours before it was ultimately breached, and the weakness that followed was significant. Sellers once again initiated a multi-week balance breakdown, this time gaining meaningful traction below the range.
The RTH session opened on a true gap down, and it was reasonable to expect some form of inventory correction at the open given the notable overnight weakness. We did get an inventory correction, but it was rather lackluster, with the full session VWAP capping the upside. The subsequent failure to hold the opening level accelerated the downside pressure. The market cleaned up the poor structure left behind from November 25 and tested our support area from the Weekly Plan between 6730 and the Weekly Extreme Low at 6700, from which a significant reversal unfolded. Within this support area, we also had a weekly NVPOC at 6725, which has now been cleaned up. Buyers filled the gap and closed back within the multi-week range, which was rather surprising.
The weekly support area between 6730 and 6700 capped today’s downside following another multi-week balance breakdown attempt by sellers. A double distribution trend day up was formed in the process. It is reasonable to conclude that we are not dealing with stronger timeframe sellers, as they would not have allowed a multi-week balance breakdown, initiated by a true gap down, to be fully retraced and close back inside the range.
The key question now is whether today’s notable failed attempt to gain acceptance below the balance range will instead increase confidence in the opposite direction. The immediate area of interest for gauging the strength or weakness of the auction is the highlighted single prints separating today’s distributions. Strength would be indicated by a reclaim of 6843, while weakness would be signaled by value building within today’s lower distribution, effectively negating the trend day.
In terms of levels, the Smashlevel is 6808, the upper end of today’s lower distribution. Holding above 6808 would target 6843 (UT1). Acceptance above 6843 would signal intraday strength, targeting the HVN at 6880 (UT2), with a final upside target at 6904 (FUT) under sustained buying pressure.
On the flip side, failure to hold above 6808 would shift focus to today’s afternoon pullback low at 6784 (DT1), with a final downside target at 6748 (FDT) under sustained selling pressure, where today’s intraday one-time framing down concluded.
Levels of Interest
Going into tomorrow’s session, I’ll closely observe the behavior around 6808.
Holding above 6808 would target 6843 / 6880 / 6904
Break and hold below 6808 would target 6784 / 6748
Additionally, pay attention to the following VIX levels: 25.28 and 21.84. These levels can provide confirmation of strength or weakness.
Break and hold above 6904 with VIX below 21.84 would confirm strength.
Break and hold below 6748 with VIX above 25.28 would confirm weakness.
Overall, it's important to exercise caution when trading outside of the highlighted yellow levels. A non-cooperative VIX may suggest possible reversals i.e trade setups.
Thanks Smash!
Thanks Smash! Great bounce from weekly support. Price having a hard time leaving this range!!