
ES Daily Plan | February 26, 2026
Market Context & Key Levels for the Day Ahead

— For new subscribers
The yellow levels highlighted at the bottom left of the chart are the primary intraday levels I focus on. To avoid impulsive decisions at poor trade locations, I follow a simple but effective rule: exercise caution when initiating trades outside of these yellow levels.
This means I’m cautious about chasing longs above the Final Upside Target (FUT) and shorts below the Final Downside Target (FDT). It’s important to understand that not chasing does not imply initiating a trade in the opposite direction — discipline over impulse.
Be sure to review the Weekly Plan for a broader perspective, key levels, and market expectations for the week ahead.

Contextual Analysis & Plan
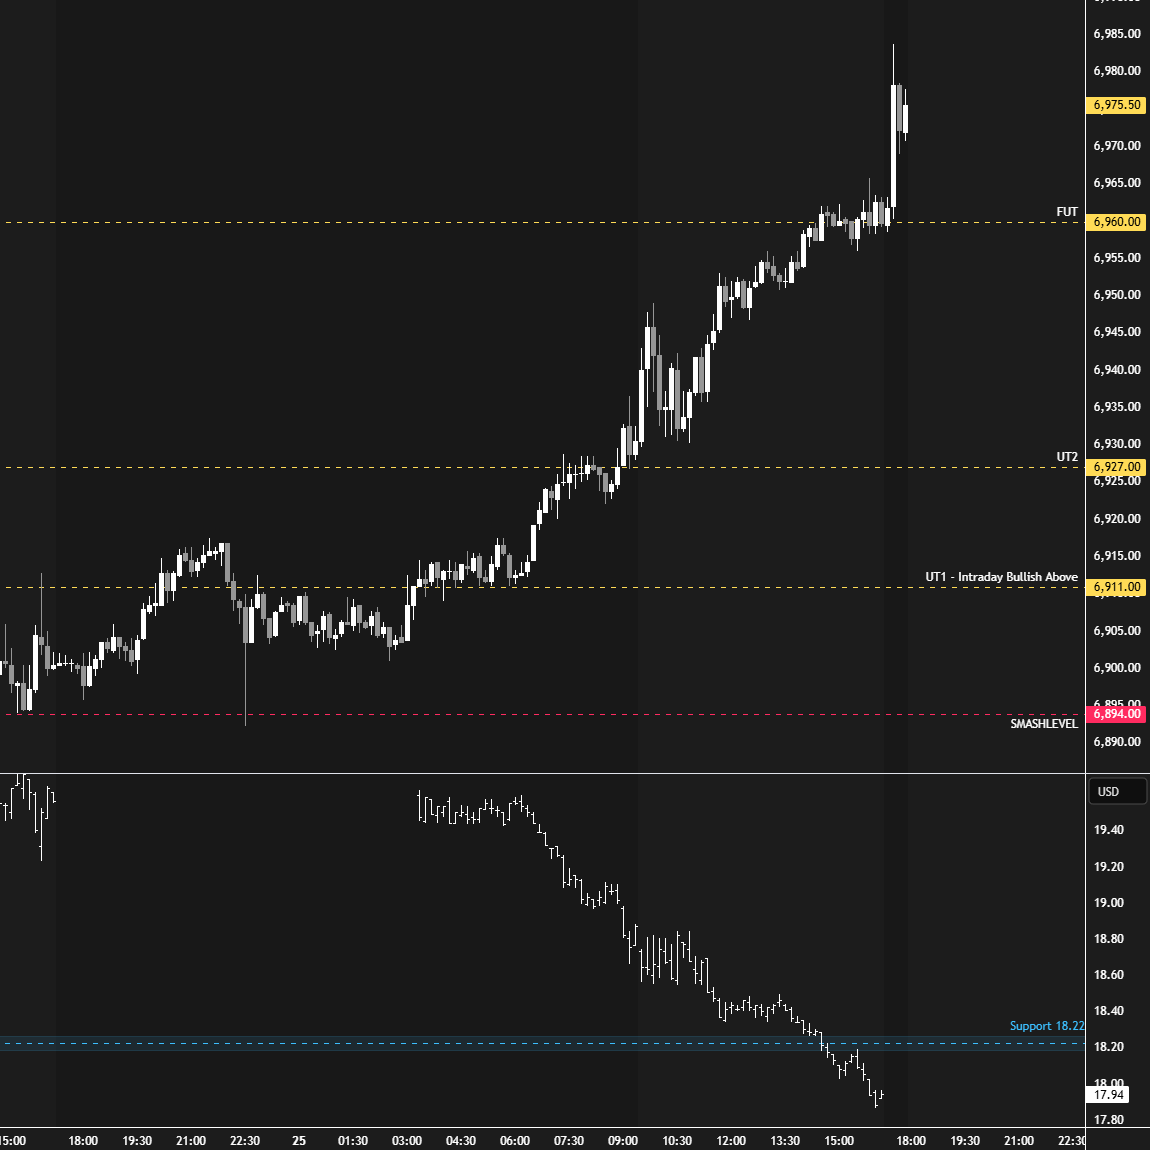
The overnight session kicked off with a slow upward grind, followed by a news-driven liquidation break that was picked up by buyers right at the Smashlevel at 6894 (ON low: 6892.25). During the European session, the market began to auction higher, exploring prices above Tuesday’s main distribution, signaling strength. The 2026 opening price at 6927 (UT2) was revisited prior to the RTH open, a level that has been acting as a magnet this year.
The RTH session opened on a true gap up following the overnight strength, and during the Initial Balance, referring to the first hour of the RTH session, the focus was on two key references: the overnight high and the opening level. These references are always crucial when the market gaps higher, as previously discussed. Buyers initially struggled to gain traction above the ON high, while sellers couldn’t break the opening level. As the auction accepted higher prices, the failure to break the opening level essentially eliminated any potential for weakness, opening the door to a cleanup of the poor structure from the February 12 trend day. This was achieved during the afternoon session, with the market tagging the Final Upside Target at 6960, where upside momentum stalled.
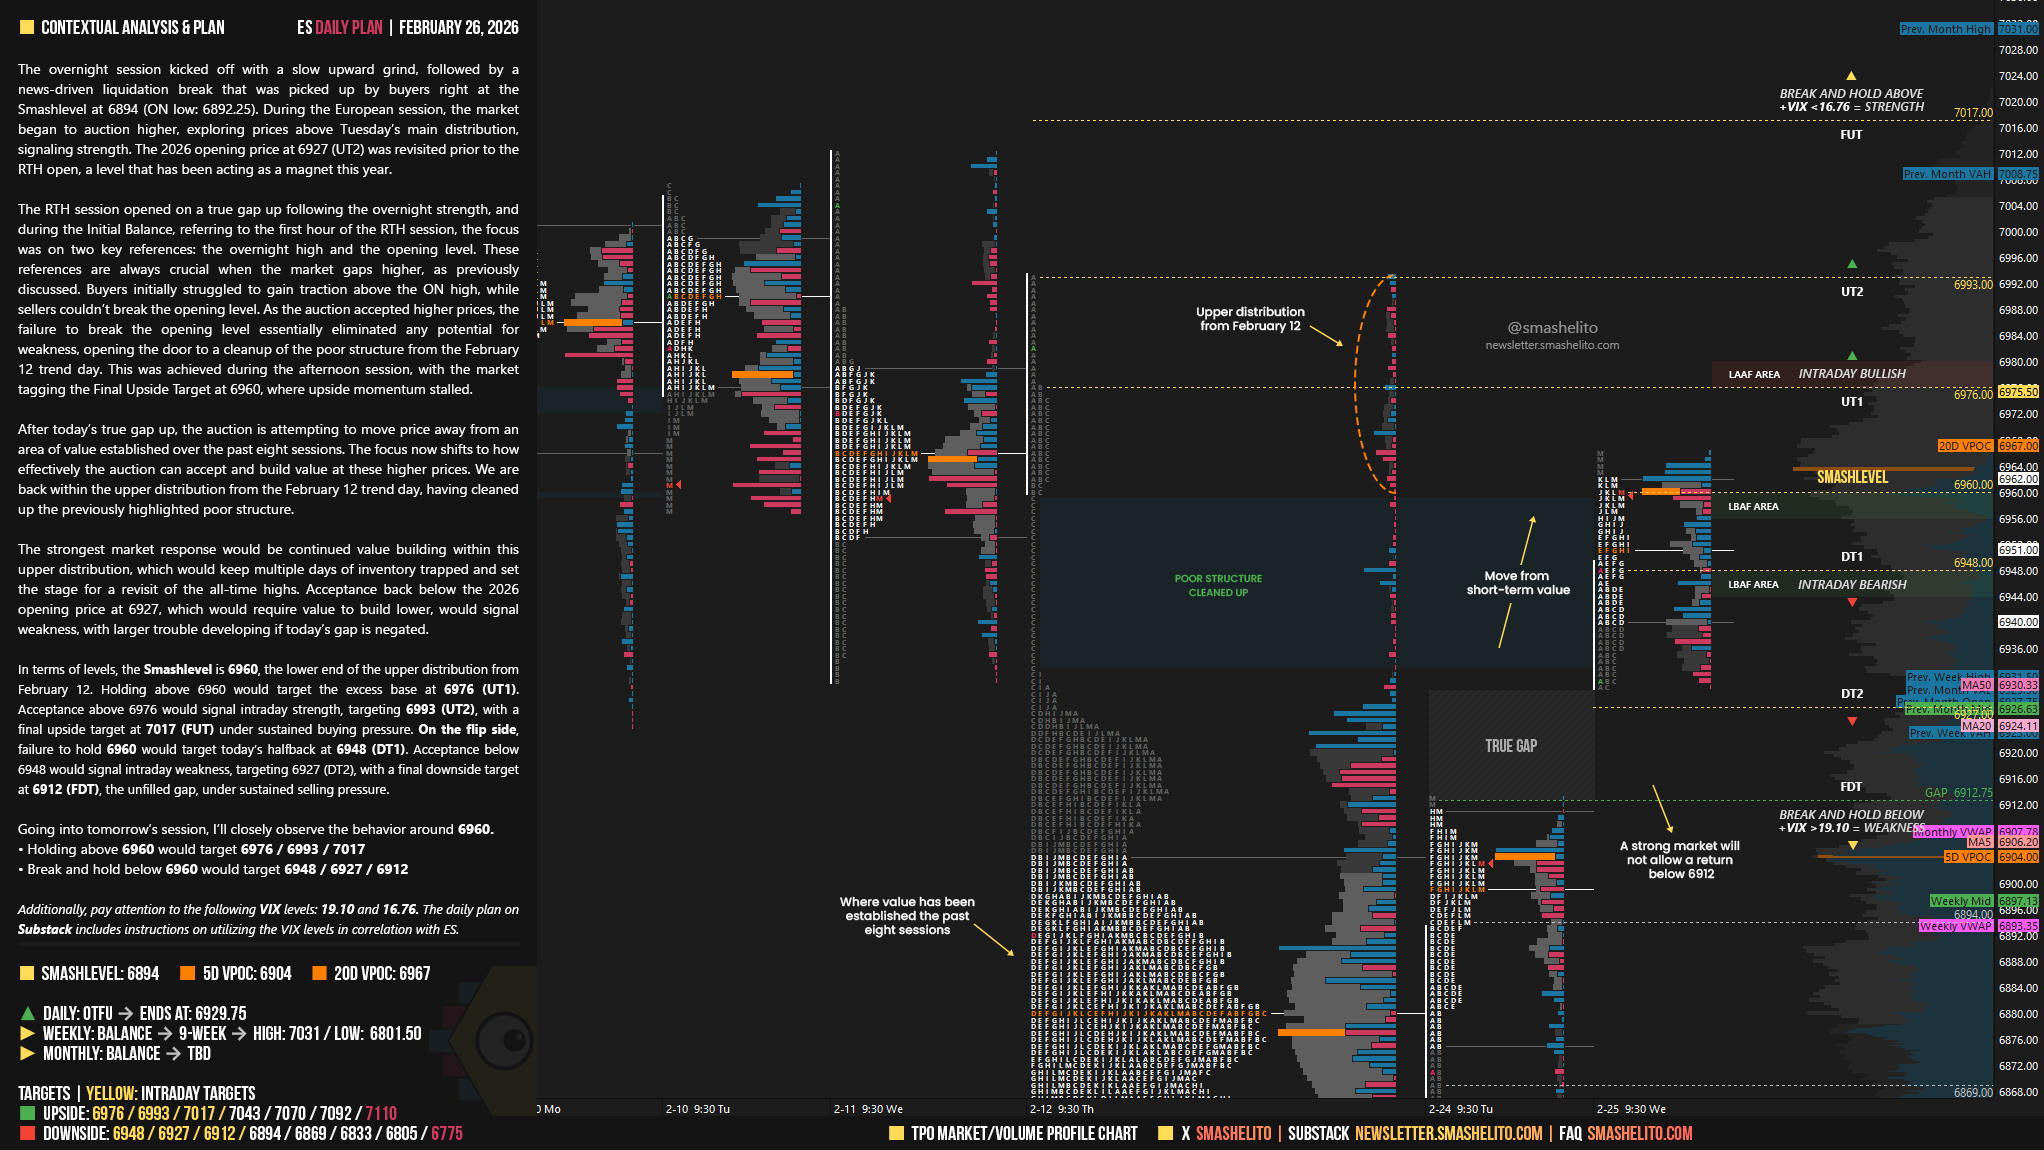
After today’s true gap up, the auction is attempting to move price away from an area of value established over the past eight sessions. The focus now shifts to how effectively the auction can accept and build value at these higher prices. We are back within the upper distribution from the February 12 trend day, having cleaned up the previously highlighted poor structure.
The strongest market response would be continued value building within this upper distribution, which would keep multiple days of inventory trapped and set the stage for a revisit of the all-time highs.
Acceptance back below the 2026 opening price at 6927, which would require value to build lower, would signal weakness, with larger trouble developing if today’s gap is negated.
In terms of levels, the Smashlevel is 6960, the lower end of the upper distribution from February 12. Holding above 6960 would target the excess base at 6976 (UT1). Acceptance above 6976 would signal intraday strength, targeting 6993 (UT2), with a final upside target at 7017 (FUT) under sustained buying pressure.
On the flip side, failure to hold 6960 would target today’s halfback at 6948 (DT1). Acceptance below 6948 would signal intraday weakness, targeting 6927 (DT2), with a final downside target at 6912 (FDT), the unfilled gap, under sustained selling pressure.
Levels of Interest
Going into tomorrow’s session, I’ll closely observe the behavior around 6960.
Holding above 6960 would target 6976 / 6993 / 7017
Break and hold below 6960 would target 6948 / 6927 / 6912
Additionally, pay attention to the following VIX levels: 19.10 and 16.76. These levels can provide confirmation of strength or weakness.
Break and hold above 7017 with VIX below 16.76 would confirm strength.
Break and hold below 6912 with VIX above 19.10 would confirm weakness.
Overall, it's important to exercise caution when trading outside of the highlighted yellow levels. A non-cooperative VIX may suggest possible reversals i.e trade setups.
Thanks Smash! Weekly Smashlevel on the line now!
Learning every day from the best, have a great smash session!