
ES Daily Plan | February 19, 2026
Market Context & Key Levels for the Day Ahead

— For new subscribers
The yellow levels highlighted at the bottom left of the chart are the primary intraday levels I focus on. To avoid impulsive decisions at poor trade locations, I follow a simple but effective rule: exercise caution when initiating trades outside of these yellow levels.
This means I’m cautious about chasing longs above the Final Upside Target (FUT) and shorts below the Final Downside Target (FDT). It’s important to understand that not chasing does not imply initiating a trade in the opposite direction — discipline over impulse.
Be sure to review the Weekly Plan for a broader perspective, key levels, and market expectations for the week ahead.

Contextual Analysis & Plan
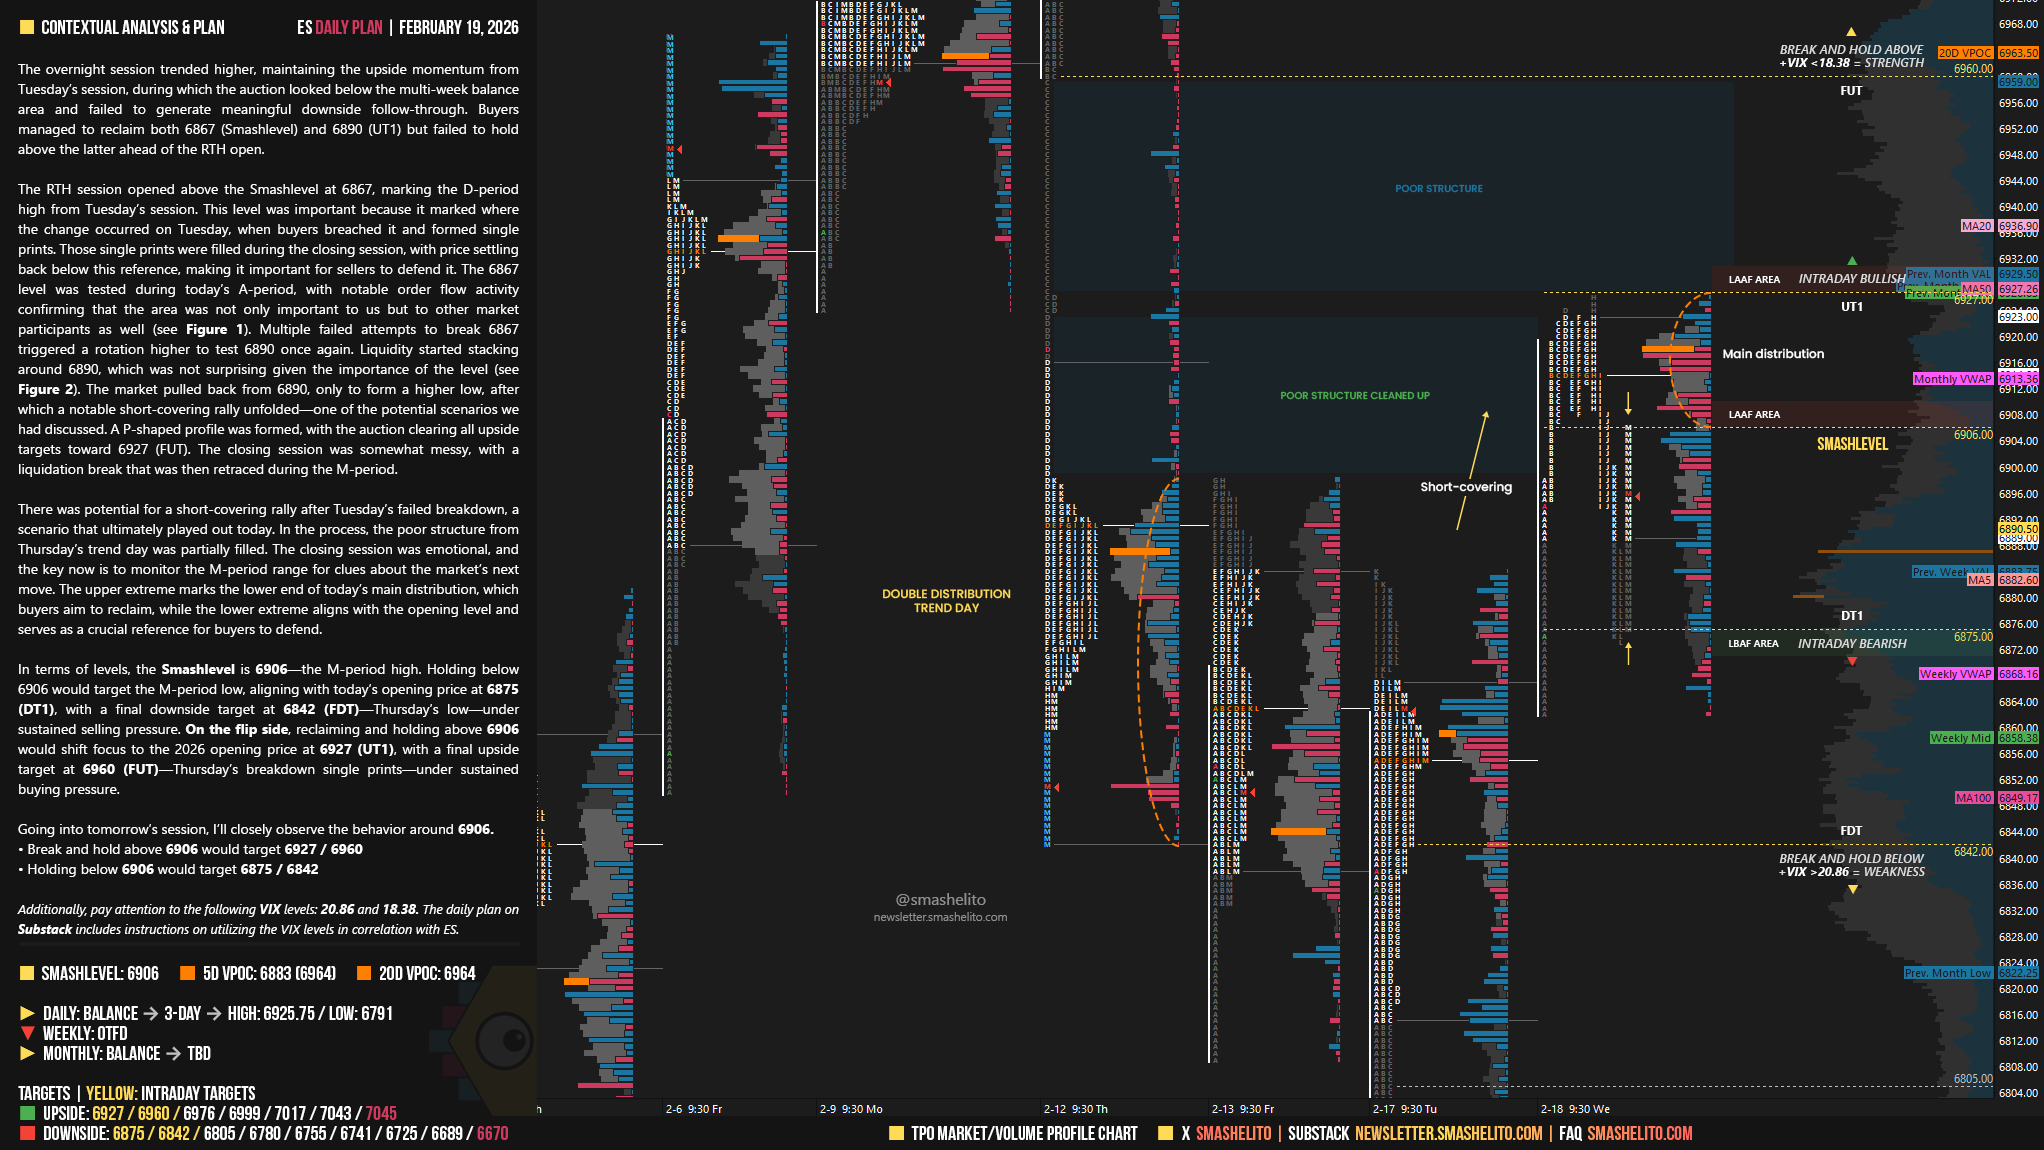
The overnight session trended higher, maintaining the upside momentum from Tuesday’s session, during which the auction looked below the multi-week balance area and failed to generate meaningful downside follow-through. Buyers managed to reclaim both 6867 (Smashlevel) and 6890 (UT1) but failed to hold above the latter ahead of the RTH open.
The RTH session opened above the Smashlevel at 6867, marking the D-period high from Tuesday’s session. This level was important because it marked where the change occurred on Tuesday, when buyers breached it and formed single prints. Those single prints were filled during the closing session, with price settling back below this reference, making it important for sellers to defend it. The 6867 level was tested during today’s A-period, with notable order flow activity confirming that the area was not only important to us but to other market participants as well (see Figure 1).
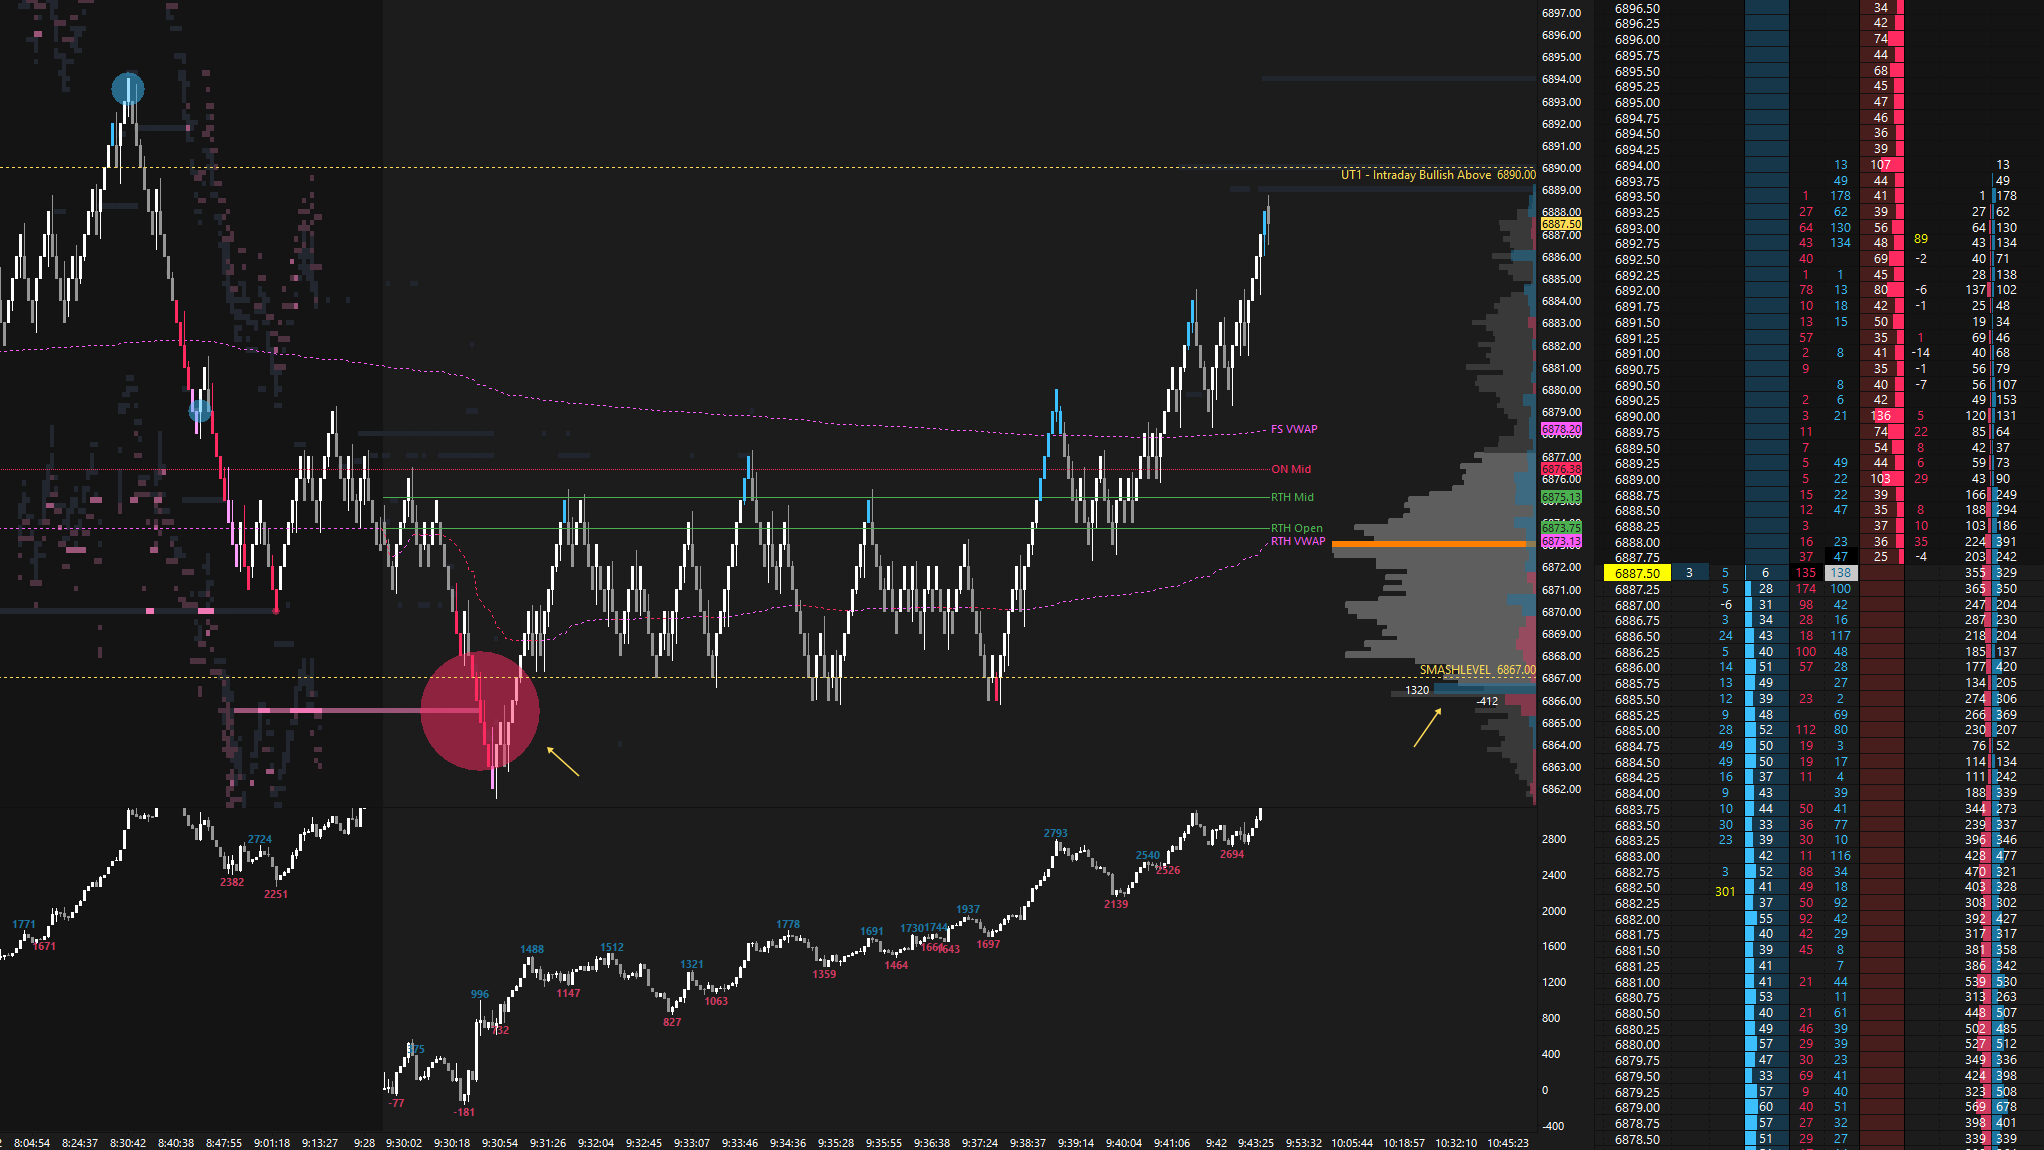
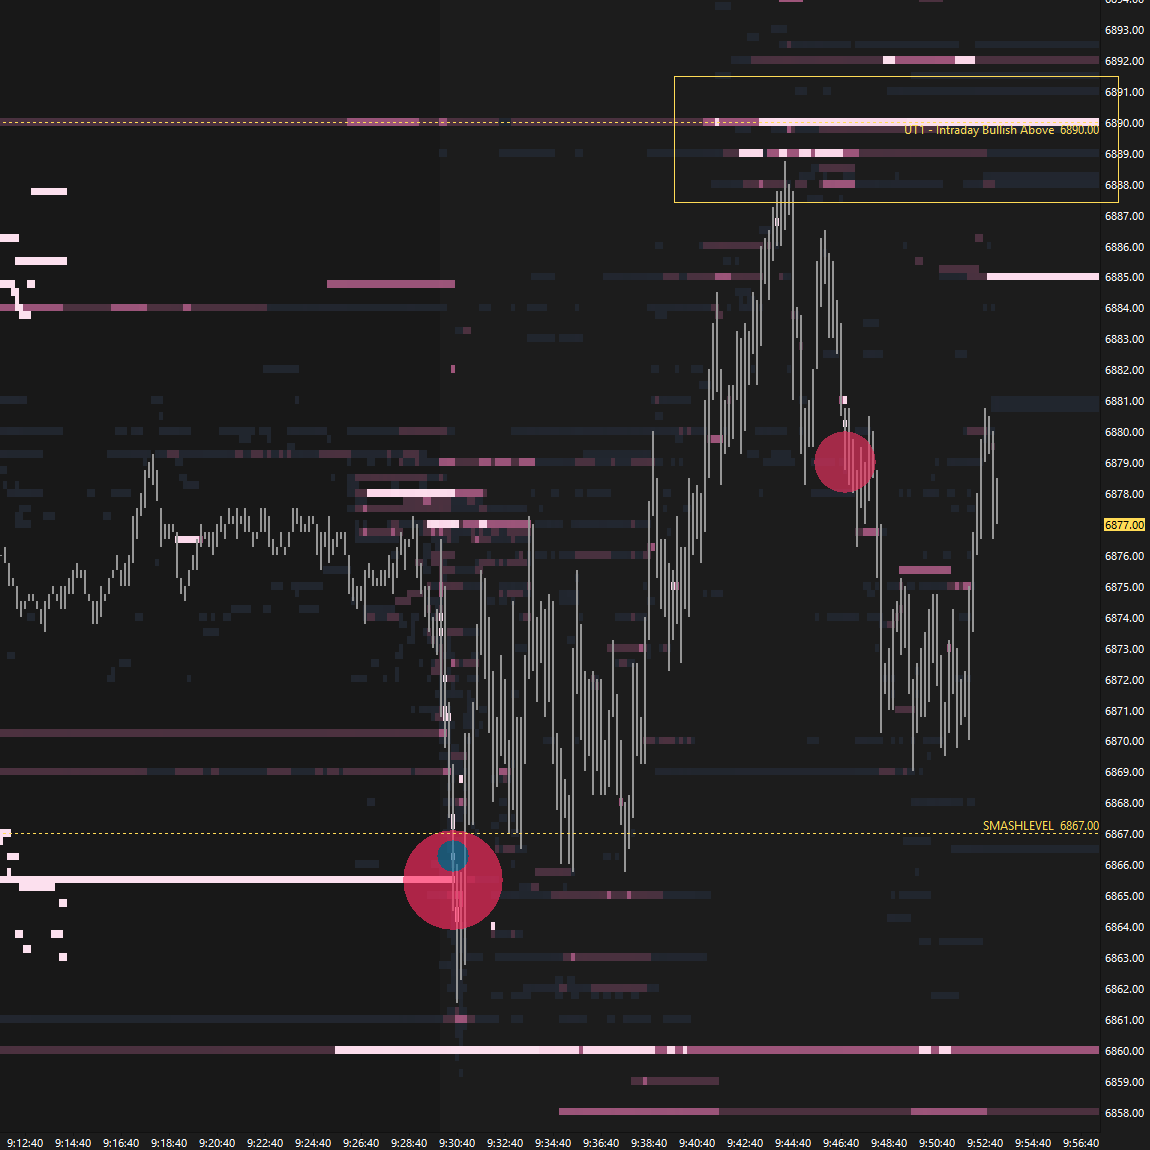
Multiple failed attempts to break 6867 triggered a rotation higher to test 6890 once again. Liquidity started stacking around 6890, which was not surprising given the importance of the level (see Figure 2). The market pulled back from 6890, only to form a higher low, after which a notable short-covering rally unfolded—one of the potential scenarios we had discussed. A P-shaped profile was formed, with the auction clearing all upside targets toward 6927 (FUT). The closing session was somewhat messy, with a liquidation break that was then retraced during the M-period.
There was potential for a short-covering rally after Tuesday’s failed breakdown, a scenario that ultimately played out today. In the process, the poor structure from Thursday’s trend day was partially filled. The closing session was emotional, and the key now is to monitor the M-period range for clues about the market’s next move.
The upper extreme marks the lower end of today’s main distribution, which buyers aim to reclaim, while the lower extreme aligns with the opening level and serves as a crucial reference for buyers to defend.
In terms of levels, the Smashlevel is 6906—the M-period high. Holding below 6906 would target the M-period low, aligning with today’s opening price at 6875 (DT1), with a final downside target at 6842 (FDT)—Thursday’s low—under sustained selling pressure.
On the flip side, reclaiming and holding above 6906 would shift focus to the 2026 opening price at 6927 (UT1), with a final upside target at 6960 (FUT)—Thursday’s breakdown single prints—under sustained buying pressure.
Levels of Interest
Going into tomorrow’s session, I’ll closely observe the behavior around 6906.
Break and hold above 6906 would target 6927 / 6960
Holding below 6906 would target 6875 / 6842
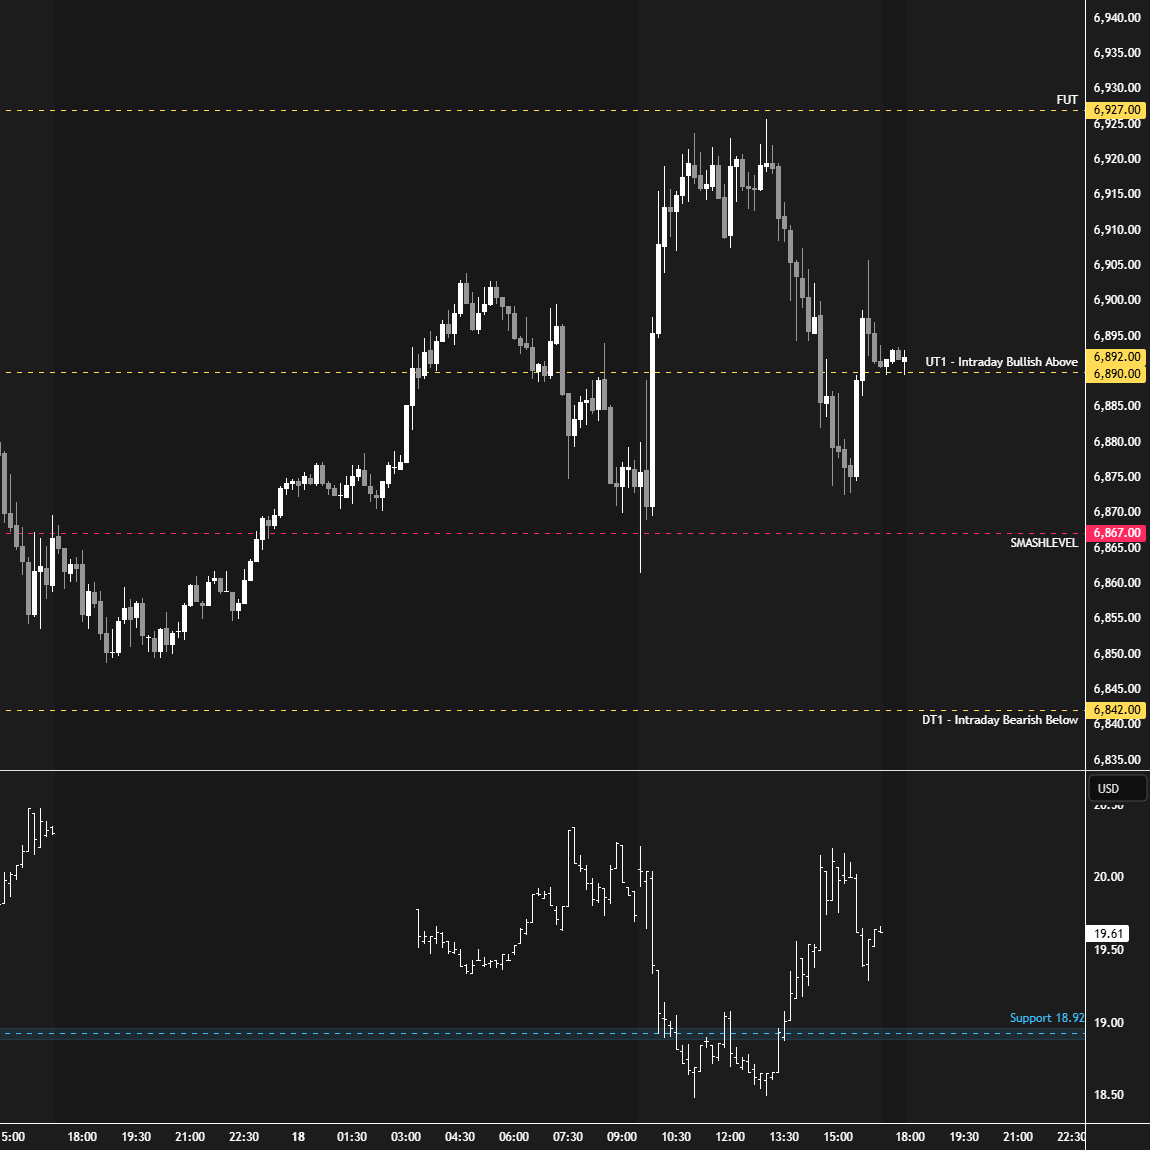
Additionally, pay attention to the following VIX levels: 20.86 and 18.38. These levels can provide confirmation of strength or weakness.
Break and hold above 6960 with VIX below 18.38 would confirm strength.
Break and hold below 6842 with VIX above 20.86 would confirm weakness.
Overall, it's important to exercise caution when trading outside of the highlighted yellow levels. A non-cooperative VIX may suggest possible reversals i.e trade setups.
Thanks Smash, have a great session!
Thank you for detailed explanation